

Pola sebenarnya

Inverse Head and Shoulder
was formed on 27.03 at 03:05:48 (UTC+0)
signal strength 1 of 5

According to the chart of M5, NZDUSD formed the Inverse Head and Shoulder pattern. The Head’s top is set at 0.5723 while the median line of the Neck is found at 0.5705/0.5719. The formation of the Inverse Head and Shoulder pattern evidently signals a reversal of the downward trend. In other words, in case the scenario comes true, the price of NZDUSD will go towards 0.5738
The M5 and M15 time frames may have more false entry points.
- All
- All
- Bearish Rectangle
- Bearish Symmetrical Triangle
- Bearish Symmetrical Triangle
- Bullish Rectangle
- Double Top
- Double Top
- Triple Bottom
- Triple Bottom
- Triple Top
- Triple Top
- All
- All
- Buy
- Sale
- All
- 1
- 2
- 3
- 4
- 5
Bawah Triple
was formed on 18.04 at 20:00:39 (UTC+0)
signal strength 2 of 5

Pola Bawah Triple telah terbentuk pada grafik AUDCAD M15. Fitur-fitur pola: garis bawah pola memiliki koordinat 0.8845 dengan batas atas 0.8845/0.8836, proyeksi lebar adalah 26 poin. Pembentukan pola Bawah Triple
Rangka waktu M5 dan M15 mungkin memiliki lebih dari titik entri yang keliru.
Open chart in a new window
Bawah Triple
was formed on 18.04 at 20:00:30 (UTC+0)
signal strength 2 of 5

Pola Bawah Triple telah terbentuk pada grafik instrumen trading NZDCHF M15. Pola tersebut menandakan perubahan dalam trend dari menurun menjadi naik jika terjadi pemecahan (breakdown) 0.4858/0.4854
Rangka waktu M5 dan M15 mungkin memiliki lebih dari titik entri yang keliru.
Open chart in a new window
Bawah Triple
was formed on 18.04 at 20:00:30 (UTC+0)
signal strength 3 of 5
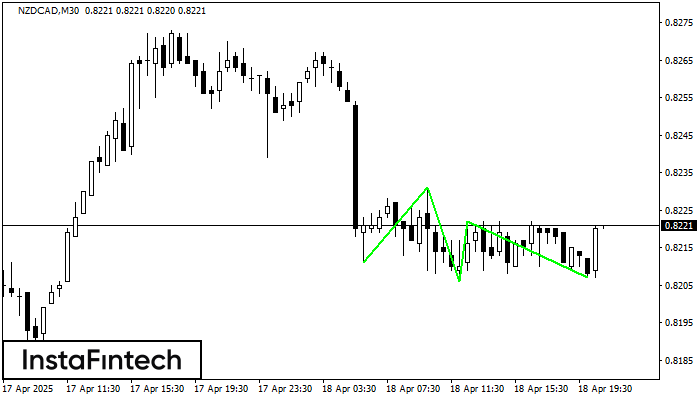
Pola Bawah Triple telah terbentuk pada grafik instrumen trading NZDCAD M30. Pola tersebut menandakan perubahan dalam trend dari menurun menjadi naik jika terjadi pemecahan (breakdown) 0.8231/0.8222
Open chart in a new window


