

Pola sebenarnya

Triple Bottom
was formed on 18.04 at 20:00:39 (UTC+0)
signal strength 2 of 5

The Triple Bottom pattern has formed on the chart of AUDCAD M15. Features of the pattern: The lower line of the pattern has coordinates 0.8845 with the upper limit 0.8845/0.8836, the projection of the width is 26 points. The formation of the Triple Bottom pattern most likely indicates a change in the trend from downward to upward. This means that in the event of a breakdown of the resistance level 0.8819, the price is most likely to continue the upward movement.
The M5 and M15 time frames may have more false entry points.
Lihat juga
- All
- All
- Bearish Rectangle
- Bearish Symmetrical Triangle
- Bearish Symmetrical Triangle
- Bullish Rectangle
- Double Top
- Double Top
- Triple Bottom
- Triple Bottom
- Triple Top
- Triple Top
- All
- All
- Buy
- Sale
- All
- 1
- 2
- 3
- 4
- 5
Persegi Bearish
was formed on 30.04 at 23:45:43 (UTC+0)
signal strength 1 of 5
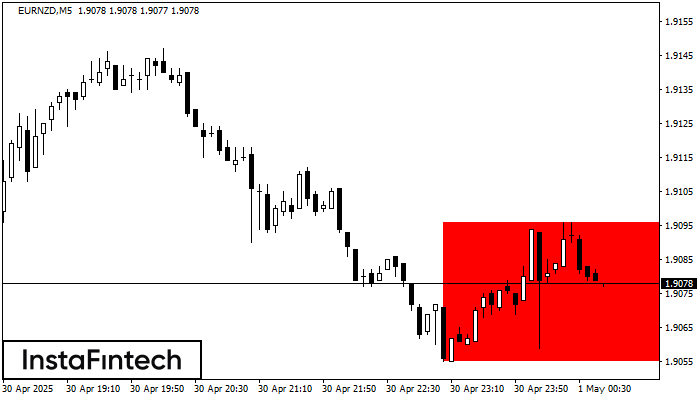
Menurut grafik dari M5, EURNZD terbentuk Persegi Bearish. Jenis pola ini menunjukkan kelanjutan tren. Terdiri dari dua tingkat: resistance 1.9096 - 0.0000 dan support 1.9055 – 1.9055. Jika level resistance
Rangka waktu M5 dan M15 mungkin memiliki lebih dari titik entri yang keliru.
Open chart in a new window
Teratas Ganda
was formed on 30.04 at 23:00:21 (UTC+0)
signal strength 5 of 5

Pada grafik NZDCAD D1 pola reversal Teratas Ganda telah terbentuk. Karakteristik: batas atas 0.8316; batas bawah 0.7826; lebar pola 490 poin. Sinyal: tembusan ke batas bawah akan menyebabkan kelanjutan tren
Open chart in a new window
Bawah Triple
was formed on 30.04 at 22:40:20 (UTC+0)
signal strength 1 of 5
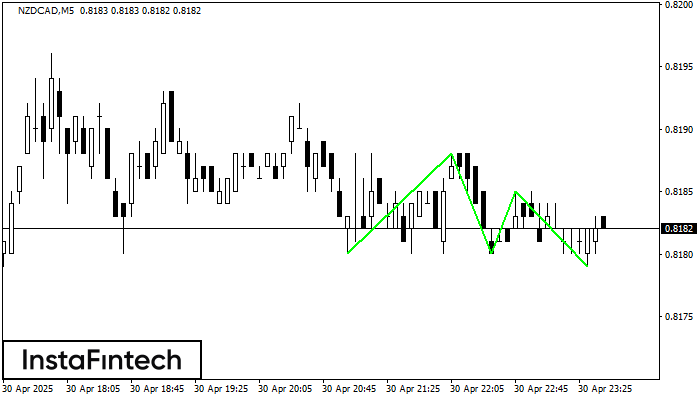
Pola Bawah Triple telah terbentuk pada NZDCAD M5. Pola tersebut memiliki karakteristik sebagai berikut: level resistance 0.8188/0.8185; level support 0.8180/0.8179; dengan lebar 8 poin. Jika terjadi pemecahan (breakdown) pada level
Rangka waktu M5 dan M15 mungkin memiliki lebih dari titik entri yang keliru.
Open chart in a new window


