

Các mẫu thực tế

Các mẫu là các mô hình đồ họa được hình thành trong biểu đồ theo giá. Theo một trong những định đề phân tích kỹ thuật, lịch sử (chuyển động giá) thường tự lặp lại. Có nghĩa là biến động giá thường giống nhau trong các tình huống giống nhau, do đó có thể dự đoán chuyển động tiếp theo của tình huống với xác suất cao.
Các mẫu hữu quan của InstaTrade là một dịch vụ dễ sử dụng cho phép bạn nhận biết được những thay đổi mới nhất trên thị trường và phản ứng kịp thời với các dấu hiệu từ thị trường. Trong dịch vụ của chúng tôi, bạn sẽ luôn tìm thấy các mẫu mới nhất và phù hợp nhất trên bất kỳ cặp nào và bất kỳ khung thời gian nào.
Triple Top
was formed on 18.04 at 18:00:33 (UTC+0)
signal strength 3 of 5
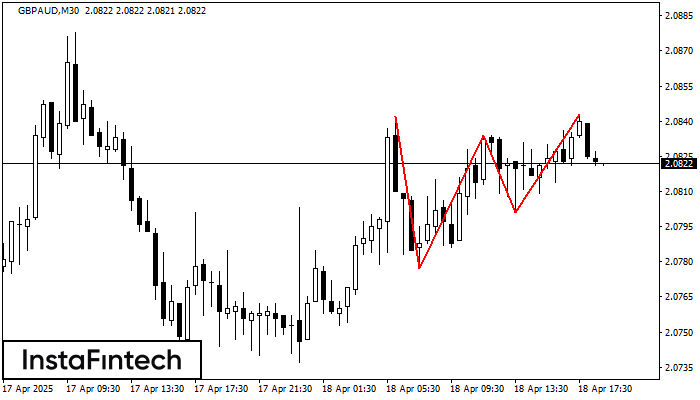
The Triple Top pattern has formed on the chart of the GBPAUD M30. Features of the pattern: borders have an ascending angle; the lower line of the pattern has the coordinates 2.0777/2.0801 with the upper limit 2.0842/2.0843; the projection of the width is 65 points. The formation of the Triple Top figure most likely indicates a change in the trend from upward to downward. This means that in the event of a breakdown of the support level of 2.0777, the price is most likely to continue the downward movement.
- All
- All
- Bearish Rectangle
- Bearish Symmetrical Triangle
- Bearish Symmetrical Triangle
- Bullish Rectangle
- Double Top
- Double Top
- Triple Bottom
- Triple Bottom
- Triple Top
- Triple Top
- All
- All
- Buy
- Sale
- All
- 1
- 2
- 3
- 4
- 5
รูปแบบสามเหลี่ยมสมมาตรขาลง (Bearish Symmetrical Triangle)
was formed on 01.05 at 01:16:49 (UTC+0)
signal strength 2 of 5
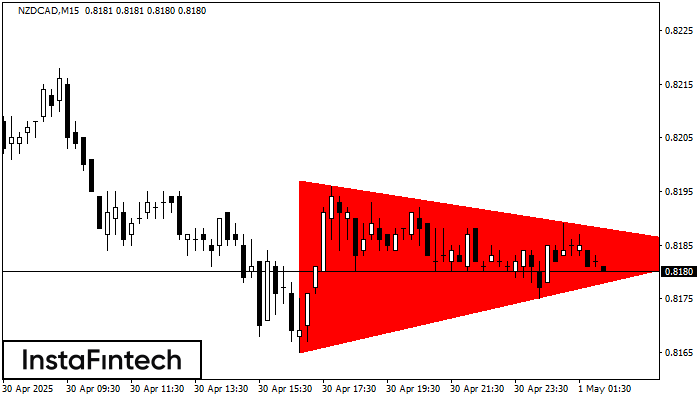
อ้างอิงจากชาร์ตของ M15, NZDCAD ที่ได้สร้างรูปแบบ รูปแบบสามเหลี่ยมสมมาตรขาลง (Bearish Symmetrical Triangle) ออกมา คำอธิบาย: ขอบเขตด้านล่างคือ 0.8165/0.8184 และขอบเขตด้านบนคือ 0.8197/0.8184 ความกว้างของรูปแบบจะวัดจากชาร์ตใน
ขอบเตระยะเวลาใน M5 และ M15 อาจจะมีตำแหน่งการเข้าใช้งานที่ผิดพลาดมากยิ่งขึ้น
Open chart in a new window
รูปแบบกราฟจุดสองยอด (Double Top)
was formed on 01.05 at 01:15:25 (UTC+0)
signal strength 2 of 5
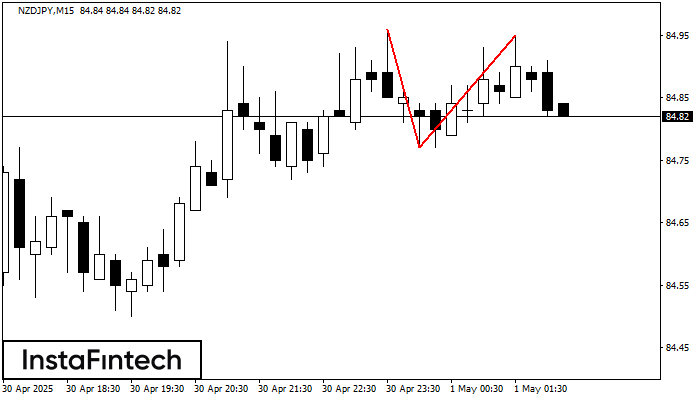
ในชาร์ตของ NZDJPY M15 พบว่า กราฟรูปแบบย้อนกลับ รูปแบบกราฟจุดสองยอด (Double Top) ได้ถูกสร้างขึ้นมา คุณลักษณะ: ขอบเขตด้านบน 84.95; ขอบเขตด้านล่าง 84.77; ความกว้างของกราฟรูปแบบนี้คือ
ขอบเตระยะเวลาใน M5 และ M15 อาจจะมีตำแหน่งการเข้าใช้งานที่ผิดพลาดมากยิ่งขึ้น
Open chart in a new window
รูปแบบกราฟจุดสองยอด (Double Top)
was formed on 01.05 at 01:15:22 (UTC+0)
signal strength 2 of 5
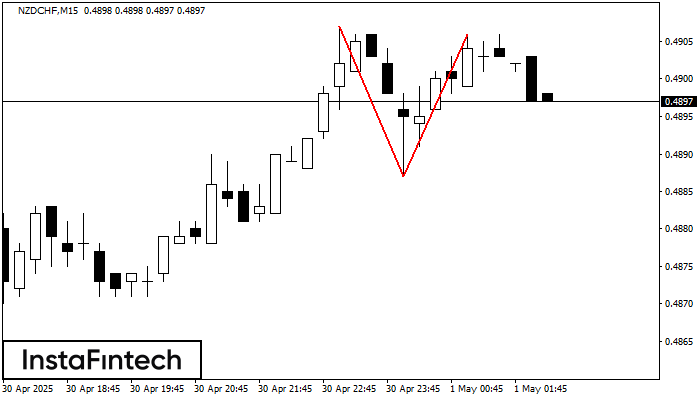
รูปแบบการย้อนตัว รูปแบบกราฟจุดสองยอด (Double Top) ได้ถูกสร้างขึ้นมาใน NZDCHF M15 คุณลักษณะ: ขอบเขตด้านบน 0.4907; ขอบเขตด้านล่าง 0.4887; ความกว้างของกราฟรูปแบบนี้คือ 19 จุด
ขอบเตระยะเวลาใน M5 และ M15 อาจจะมีตำแหน่งการเข้าใช้งานที่ผิดพลาดมากยิ่งขึ้น
Open chart in a new window
