

Các mẫu thực tế

Các mẫu là các mô hình đồ họa được hình thành trong biểu đồ theo giá. Theo một trong những định đề phân tích kỹ thuật, lịch sử (chuyển động giá) thường tự lặp lại. Có nghĩa là biến động giá thường giống nhau trong các tình huống giống nhau, do đó có thể dự đoán chuyển động tiếp theo của tình huống với xác suất cao.
Các mẫu hữu quan của InstaTrade là một dịch vụ dễ sử dụng cho phép bạn nhận biết được những thay đổi mới nhất trên thị trường và phản ứng kịp thời với các dấu hiệu từ thị trường. Trong dịch vụ của chúng tôi, bạn sẽ luôn tìm thấy các mẫu mới nhất và phù hợp nhất trên bất kỳ cặp nào và bất kỳ khung thời gian nào.
Triple Top
was formed on 30.03 at 11:20:04 (UTC+0)
signal strength 1 of 5

On the chart of the #Bitcoin M5 trading instrument, the Triple Top pattern that signals a trend change has formed. It is possible that after formation of the third peak, the price will try to break through the resistance level 82818.73, where we advise to open a trading position for sale. Take profit is the projection of the pattern’s width, which is 46117 points.
The M5 and M15 time frames may have more false entry points.
Xem thêm
- All
- All
- Bearish Rectangle
- Bearish Symmetrical Triangle
- Bearish Symmetrical Triangle
- Bullish Rectangle
- Double Top
- Double Top
- Triple Bottom
- Triple Bottom
- Triple Top
- Triple Top
- All
- All
- Buy
- Sale
- All
- 1
- 2
- 3
- 4
- 5
Double Top
сформирован 02.04 в 08:00:26 (UTC+0)
сила сигнала 2 из 5
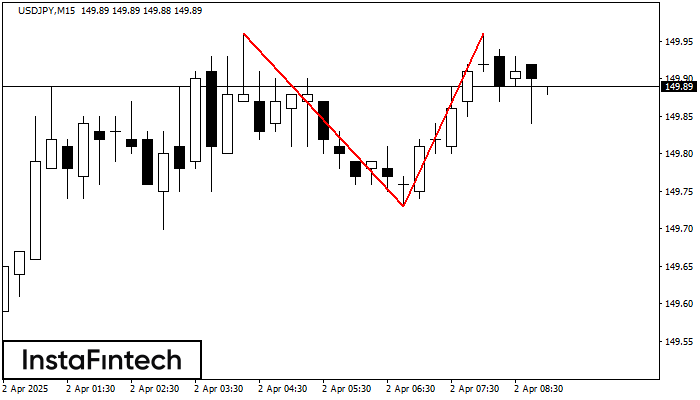
The Double Top pattern has been formed on USDJPY M15. It signals that the trend has been changed from upwards to downwards. Probably, if the base of the pattern 149.73
The M5 and M15 time frames may have more false entry points.
Открыть график инструмента в новом окне
Triple Top
сформирован 02.04 в 06:50:26 (UTC+0)
сила сигнала 1 из 5
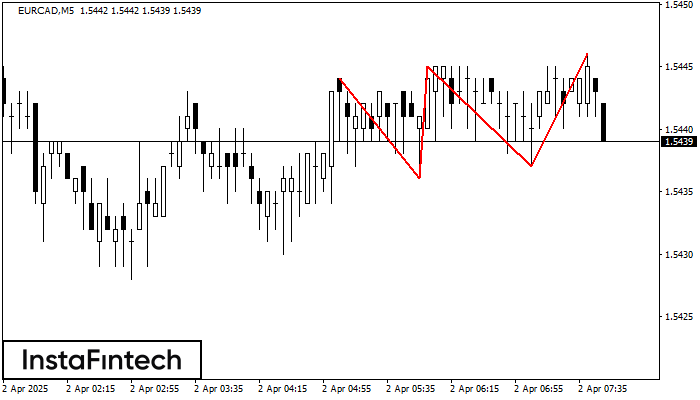
The Triple Top pattern has formed on the chart of the EURCAD M5. Features of the pattern: borders have an ascending angle; the lower line of the pattern
The M5 and M15 time frames may have more false entry points.
Открыть график инструмента в новом окне
Bullish Rectangle
сформирован 02.04 в 06:48:50 (UTC+0)
сила сигнала 1 из 5
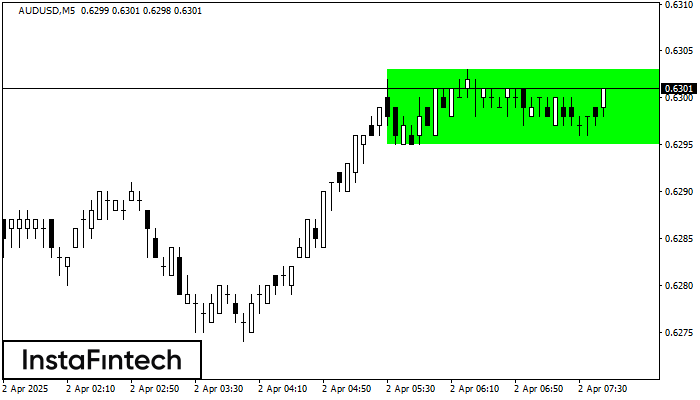
According to the chart of M5, AUDUSD formed the Bullish Rectangle. This type of a pattern indicates a trend continuation. It consists of two levels: resistance 0.6303 and support 0.6295
The M5 and M15 time frames may have more false entry points.
Открыть график инструмента в новом окне
