

Các mẫu thực tế

Các mẫu là các mô hình đồ họa được hình thành trong biểu đồ theo giá. Theo một trong những định đề phân tích kỹ thuật, lịch sử (chuyển động giá) thường tự lặp lại. Có nghĩa là biến động giá thường giống nhau trong các tình huống giống nhau, do đó có thể dự đoán chuyển động tiếp theo của tình huống với xác suất cao.
Các mẫu hữu quan của InstaTrade là một dịch vụ dễ sử dụng cho phép bạn nhận biết được những thay đổi mới nhất trên thị trường và phản ứng kịp thời với các dấu hiệu từ thị trường. Trong dịch vụ của chúng tôi, bạn sẽ luôn tìm thấy các mẫu mới nhất và phù hợp nhất trên bất kỳ cặp nào và bất kỳ khung thời gian nào.
Head and Shoulders
was formed on 28.03 at 12:14:49 (UTC+0)
signal strength 2 of 5
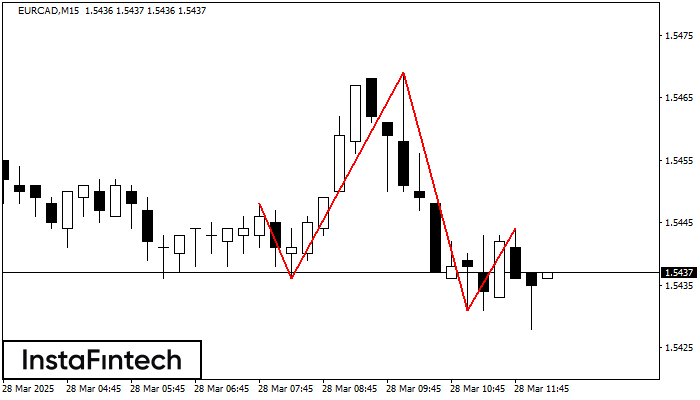
The technical pattern called Head and Shoulders has appeared on the chart of EURCAD M15. There are weighty reasons to suggest that the price will surpass the Neckline 1.5436/1.5431 after the right shoulder has been formed. So, the trend is set to change with the price heading for 1.5409.
The M5 and M15 time frames may have more false entry points.
Xem thêm
- All
- All
- Bearish Rectangle
- Bearish Symmetrical Triangle
- Bearish Symmetrical Triangle
- Bullish Rectangle
- Double Top
- Double Top
- Triple Bottom
- Triple Bottom
- Triple Top
- Triple Top
- All
- All
- Buy
- Sale
- All
- 1
- 2
- 3
- 4
- 5
Double Bottom
was formed on 31.03 at 15:30:34 (UTC+0)
signal strength 1 of 5
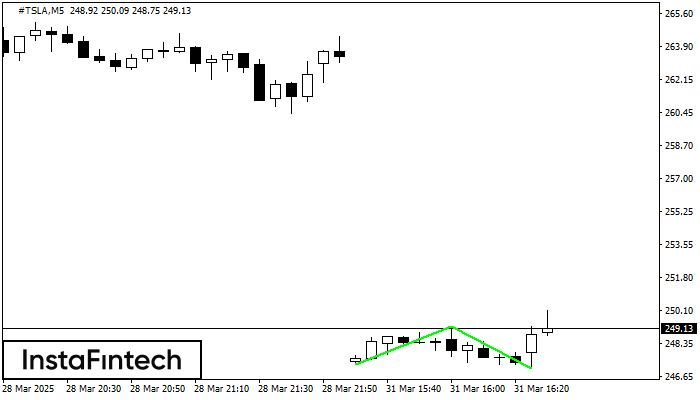
The Double Bottom pattern has been formed on #TSLA M5. This formation signals a reversal of the trend from downwards to upwards. The signal is that a buy trade should
The M5 and M15 time frames may have more false entry points.
Open chart in a new window
Double Bottom
was formed on 31.03 at 15:30:26 (UTC+0)
signal strength 1 of 5
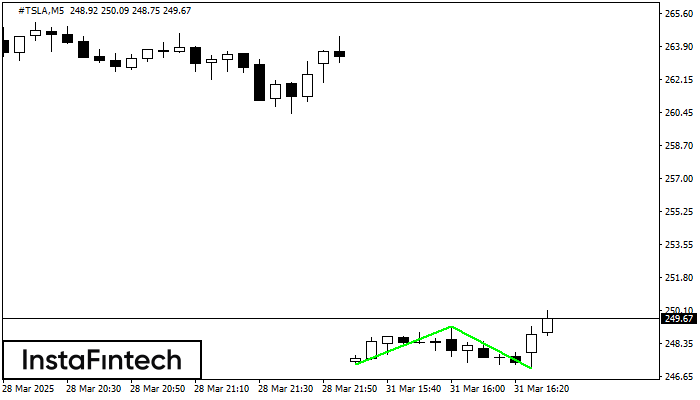
The Double Bottom pattern has been formed on #TSLA M5. This formation signals a reversal of the trend from downwards to upwards. The signal is that a buy trade should
The M5 and M15 time frames may have more false entry points.
Open chart in a new window
Bearish pennant
was formed on 31.03 at 15:25:29 (UTC+0)
signal strength 2 of 5

The Bearish pennant pattern has formed on the #AAPL M15 chart. It signals potential continuation of the existing trend. Specifications: the pattern’s bottom has the coordinate of 216.06; the projection
The M5 and M15 time frames may have more false entry points.
Open chart in a new window
