

Dolzarb patternlar

Бычий вымпел
сформирован 21.04 в 07:00:12 (UTC+0)
сила сигнала 3 из 5

Графическая фигура «Бычий вымпел» сформировалась по инструменту NZDCAD на M30. Данный вид фигуры относится к типу продолжения тенденции. В случае если котировке удастся преодолеть максимум вымпела 0.8293, то ожидается продолжение восходящего тренда к уровню 0.8323.
Shuningdek ko'ring
- Все
- Все
- Bearish Rectangle
- Bearish Symmetrical Triangle
- Bearish Symmetrical Triangle
- Bullish Rectangle
- Double Top
- Double Top
- Triple Bottom
- Triple Bottom
- Triple Top
- Triple Top
- Все
- Все
- Покупка
- Продажа
- Все
- 1
- 2
- 3
- 4
- 5
Bullish Symmetrical Triangle
was formed on 10.06 at 22:55:00 (UTC+0)
signal strength 1 of 5
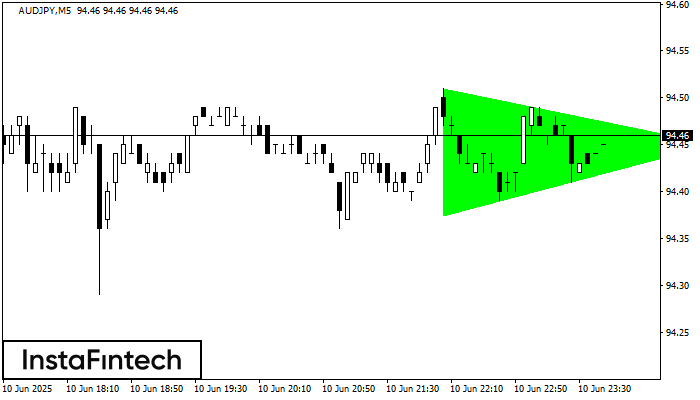
According to the chart of M5, AUDJPY formed the Bullish Symmetrical Triangle pattern. The lower border of the pattern touches the coordinates 94.37/94.45 whereas the upper border goes across 94.51/94.45
The M5 and M15 time frames may have more false entry points.
Open chart in a new window
Bullish Symmetrical Triangle
was formed on 10.06 at 22:07:52 (UTC+0)
signal strength 1 of 5
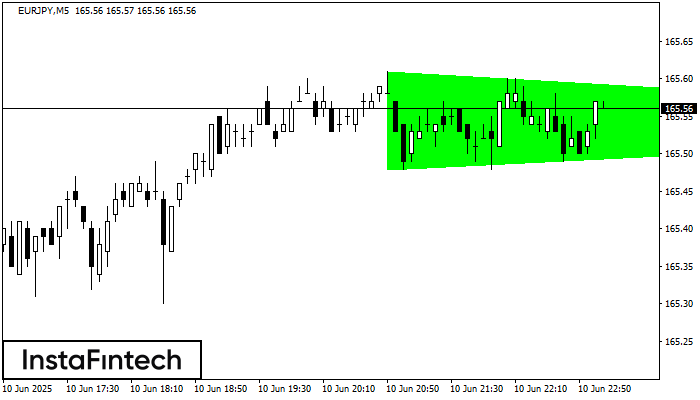
According to the chart of M5, EURJPY formed the Bullish Symmetrical Triangle pattern. Description: This is the pattern of a trend continuation. 165.61 and 165.48 are the coordinates
The M5 and M15 time frames may have more false entry points.
Open chart in a new window
Triple Bottom
was formed on 10.06 at 21:15:47 (UTC+0)
signal strength 1 of 5
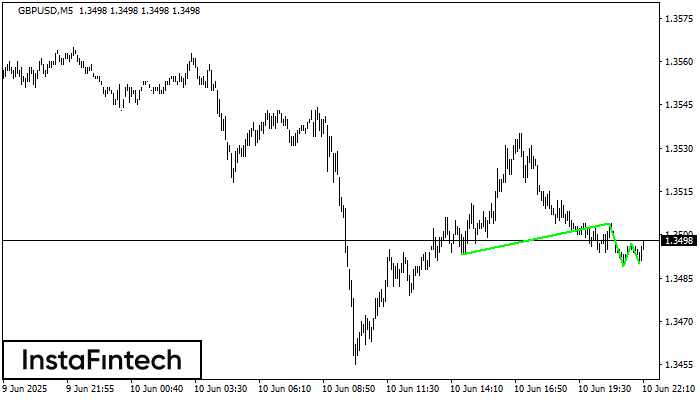
The Triple Bottom pattern has formed on the chart of GBPUSD M5. Features of the pattern: The lower line of the pattern has coordinates 1.3504 with the upper limit 1.3504/1.3497
The M5 and M15 time frames may have more false entry points.
Open chart in a new window


