

Dolzarb patternlar

Тройная вершина
сформирован 18.04 в 18:00:33 (UTC+0)
сила сигнала 3 из 5
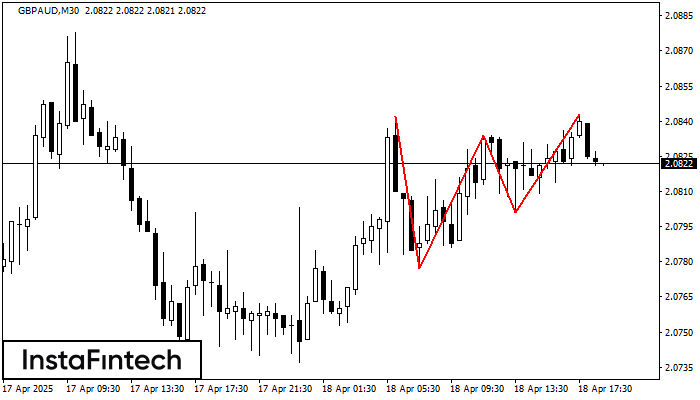
На графике GBPAUD M30 образовалась фигура «Тройная вершина», которая сигнализирует об изменении тенденции. Возможный сценарий: После формирования третьей вершины котировка постарается пробить нижнюю границу 2.0801, где трейдеру и стоило бы открывать торговую позицию на продажу. Тейк Профит - это и есть проекция ширины фигуры, которая составляет 33 пунктов.
- Все
- Все
- Bearish Rectangle
- Bearish Symmetrical Triangle
- Bearish Symmetrical Triangle
- Bullish Rectangle
- Double Top
- Double Top
- Triple Bottom
- Triple Bottom
- Triple Top
- Triple Top
- Все
- Все
- Покупка
- Продажа
- Все
- 1
- 2
- 3
- 4
- 5
Double Bottom
was formed on 11.06 at 00:00:21 (UTC+0)
signal strength 2 of 5
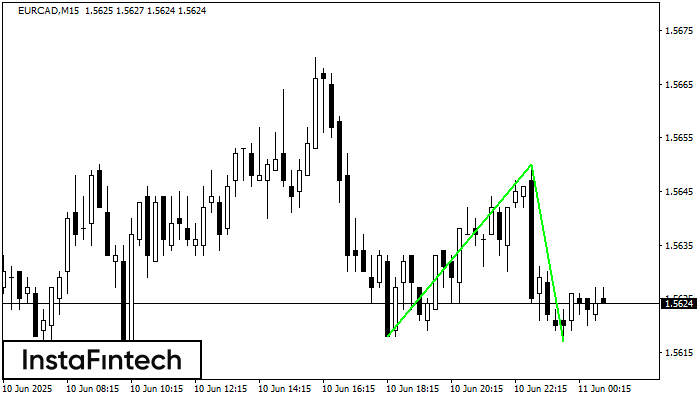
The Double Bottom pattern has been formed on EURCAD M15; the upper boundary is 1.5650; the lower boundary is 1.5617. The width of the pattern is 32 points. In case
The M5 and M15 time frames may have more false entry points.
Open chart in a new window
Head and Shoulders
was formed on 10.06 at 23:26:25 (UTC+0)
signal strength 1 of 5
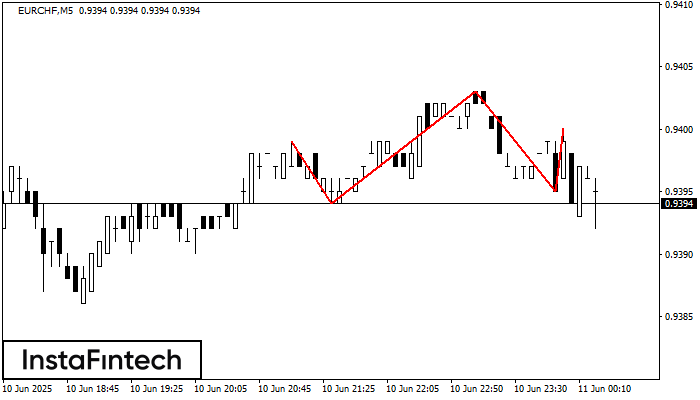
The technical pattern called Head and Shoulders has appeared on the chart of EURCHF M5. There are weighty reasons to suggest that the price will surpass the Neckline 0.9394/0.9395 after
The M5 and M15 time frames may have more false entry points.
Open chart in a new window
Bullish Symmetrical Triangle
was formed on 10.06 at 23:04:24 (UTC+0)
signal strength 1 of 5
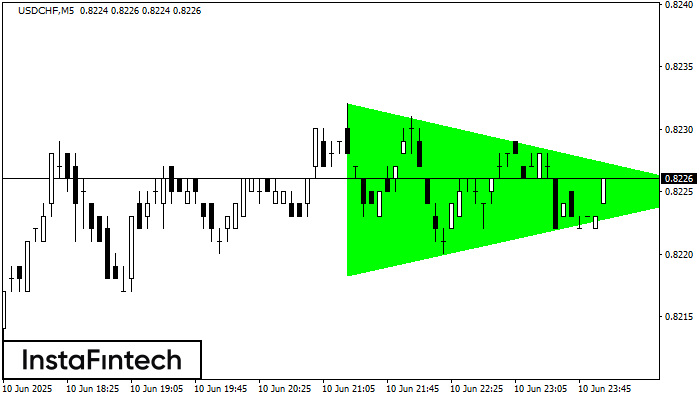
According to the chart of M5, USDCHF formed the Bullish Symmetrical Triangle pattern. The lower border of the pattern touches the coordinates 0.8218/0.8225 whereas the upper border goes across 0.8232/0.8225
The M5 and M15 time frames may have more false entry points.
Open chart in a new window


