

Dolzarb patternlar

Тройное дно
сформирован 18.04 в 16:30:12 (UTC+0)
сила сигнала 3 из 5
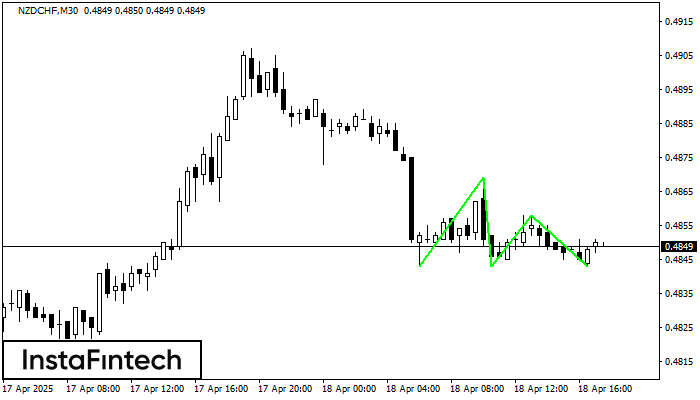
Сформирована фигура «Тройное дно» по торговому инструменту NZDCHF на M30. Фигура сигнализирует об изменении тенденции с нисходящей на восходящую в случае пробоя верхней границы 0.4858.
- Все
- Все
- Bearish Rectangle
- Bearish Symmetrical Triangle
- Bearish Symmetrical Triangle
- Bullish Rectangle
- Double Top
- Double Top
- Triple Bottom
- Triple Bottom
- Triple Top
- Triple Top
- Все
- Все
- Покупка
- Продажа
- Все
- 1
- 2
- 3
- 4
- 5
Triple Bottom
was formed on 10.06 at 09:55:51 (UTC+0)
signal strength 1 of 5
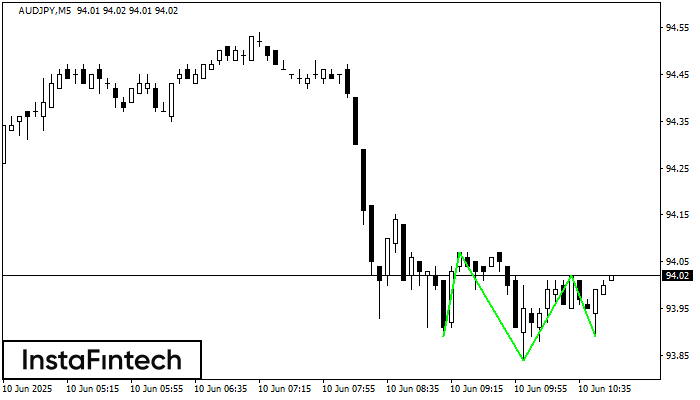
The Triple Bottom pattern has been formed on AUDJPY M5. It has the following characteristics: resistance level 94.07/94.02; support level 93.89/93.89; the width is 18 points. In the event
The M5 and M15 time frames may have more false entry points.
Open chart in a new window
Inverse Head and Shoulder
was formed on 10.06 at 09:44:57 (UTC+0)
signal strength 2 of 5
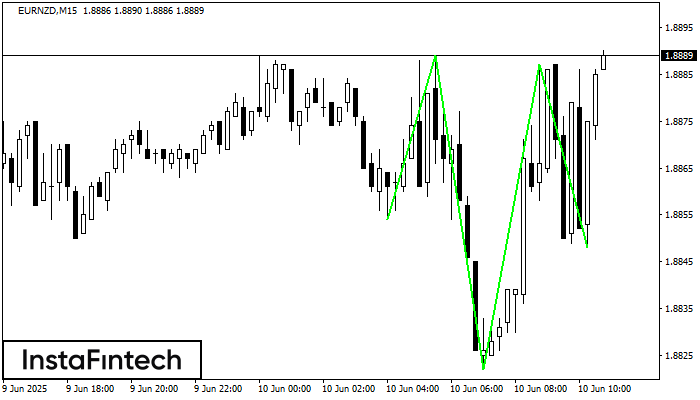
According to M15, EURNZD is shaping the technical pattern – the Inverse Head and Shoulder. In case the Neckline 1.8889/1.8887 is broken out, the instrument is likely to move toward
The M5 and M15 time frames may have more false entry points.
Open chart in a new window
Bearish Rectangle
was formed on 10.06 at 09:42:43 (UTC+0)
signal strength 1 of 5
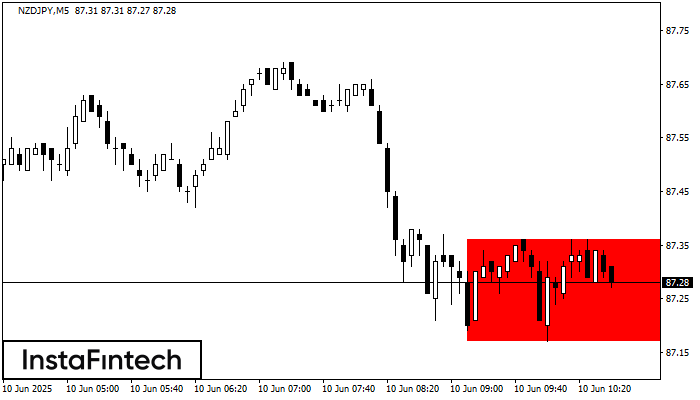
According to the chart of M5, NZDJPY formed the Bearish Rectangle. This type of a pattern indicates a trend continuation. It consists of two levels: resistance 87.36 - 0.00
The M5 and M15 time frames may have more false entry points.
Open chart in a new window


