

Dolzarb patternlar

Двойное дно
сформирован 17.04 в 15:29:57 (UTC+0)
сила сигнала 2 из 5

Сформирована фигура «Двойное дно» на графике #EBAY M15. Верхняя граница 67.35; Нижняя граница 65.16; Ширина фигуры 215 пунктов. В случае пробоя верхней границы 67.35 можно будет прогнозировать изменение тенденции, где ширина фигуры и будет являться расстоянием предположительного Тейк Профита.
Таймфреймы М5 и М15 могут иметь больше ложных точек входа.
- Все
- Все
- Bearish Rectangle
- Bearish Symmetrical Triangle
- Bearish Symmetrical Triangle
- Bullish Rectangle
- Double Top
- Double Top
- Triple Bottom
- Triple Bottom
- Triple Top
- Triple Top
- Все
- Все
- Покупка
- Продажа
- Все
- 1
- 2
- 3
- 4
- 5
Bullish Rectangle
сформирован 13.06 в 18:21:09 (UTC+0)
сила сигнала 1 из 5
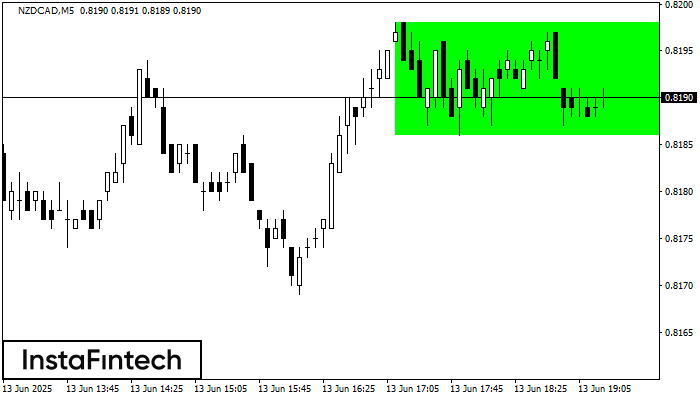
According to the chart of M5, NZDCAD formed the Bullish Rectangle which is a pattern of a trend continuation. The pattern is contained within the following borders: the lower border
The M5 and M15 time frames may have more false entry points.
Открыть график инструмента в новом окне
Triple Bottom
сформирован 13.06 в 16:30:35 (UTC+0)
сила сигнала 1 из 5
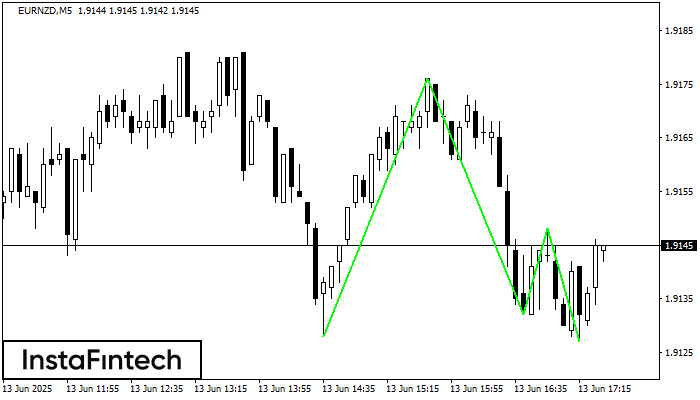
The Triple Bottom pattern has formed on the chart of the EURNZD M5 trading instrument. The pattern signals a change in the trend from downwards to upwards in the case
The M5 and M15 time frames may have more false entry points.
Открыть график инструмента в новом окне
Double Top
сформирован 13.06 в 16:00:24 (UTC+0)
сила сигнала 2 из 5
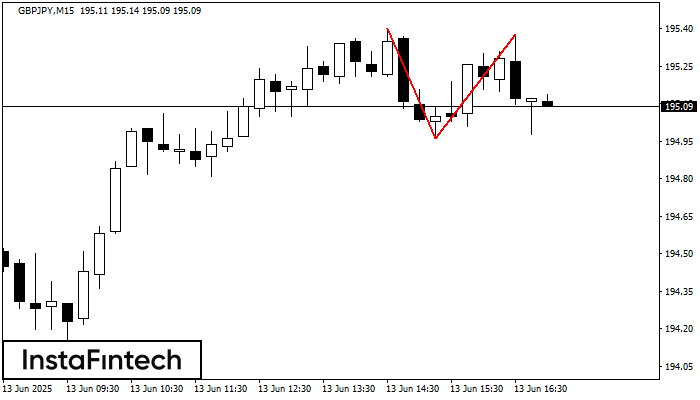
The Double Top pattern has been formed on GBPJPY M15. It signals that the trend has been changed from upwards to downwards. Probably, if the base of the pattern 194.96
The M5 and M15 time frames may have more false entry points.
Открыть график инструмента в новом окне


