

Dolzarb patternlar

Бычий симметричный треугольник
сформирован 08.04 в 14:47:55 (UTC+0)
сила сигнала 3 из 5
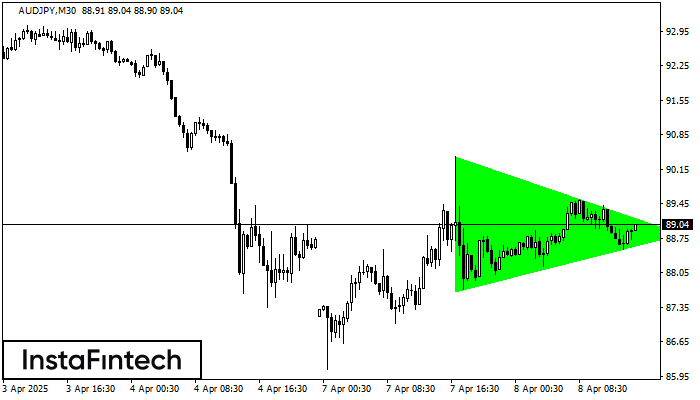
По AUDJPY на M30 фигура «Бычий симметричный треугольник». Характеристика: Фигура продолжения тренда; Координаты границ – верхняя 90.41, нижняя 87.68. Проекция ширины фигуры 273 пунктов. Прогноз: В случае пробоя верхней границы 90.41 цена, вероятнее всего, продолжит движение к 89.12.
Shuningdek ko'ring
- Все
- Все
- Bearish Rectangle
- Bearish Symmetrical Triangle
- Bearish Symmetrical Triangle
- Bullish Rectangle
- Double Top
- Double Top
- Triple Bottom
- Triple Bottom
- Triple Top
- Triple Top
- Все
- Все
- Покупка
- Продажа
- Все
- 1
- 2
- 3
- 4
- 5
Bearish Symmetrical Triangle
was formed on 12.06 at 06:05:41 (UTC+0)
signal strength 1 of 5
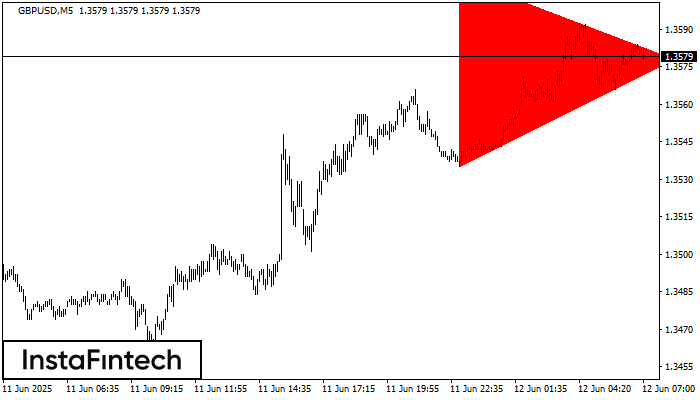
According to the chart of M5, GBPUSD formed the Bearish Symmetrical Triangle pattern. Trading recommendations: A breach of the lower border 1.3535 is likely to encourage a continuation
The M5 and M15 time frames may have more false entry points.
Open chart in a new window
Triple Bottom
was formed on 12.06 at 06:05:27 (UTC+0)
signal strength 1 of 5
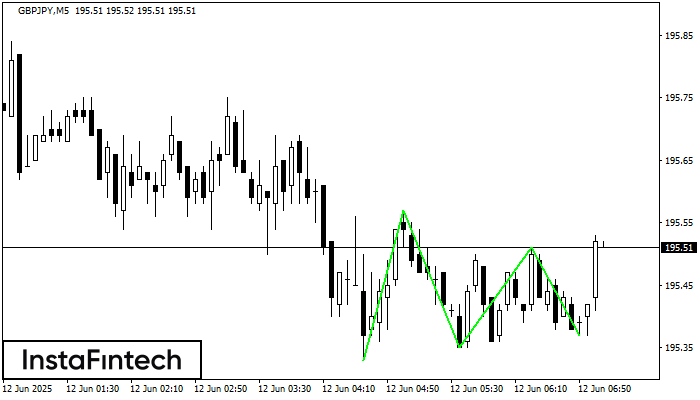
The Triple Bottom pattern has formed on the chart of GBPJPY M5. Features of the pattern: The lower line of the pattern has coordinates 195.57 with the upper limit 195.57/195.51
The M5 and M15 time frames may have more false entry points.
Open chart in a new window
Bullish Flag
was formed on 12.06 at 05:32:22 (UTC+0)
signal strength 4 of 5
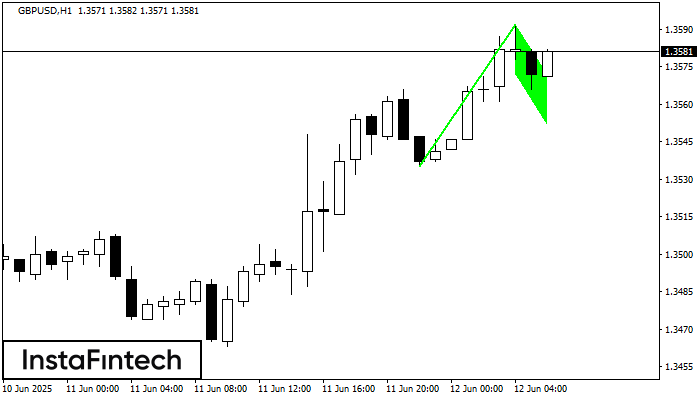
The Bullish Flag pattern which signals continuation of a trend has been formed on the chart GBPUSD H1. Forecast: if the price breaks above the pattern high at 1.3592, then
Open chart in a new window


