

Dolzarb patternlar

Двойное дно
сформирован 31.03 в 15:30:26 (UTC+0)
сила сигнала 1 из 5
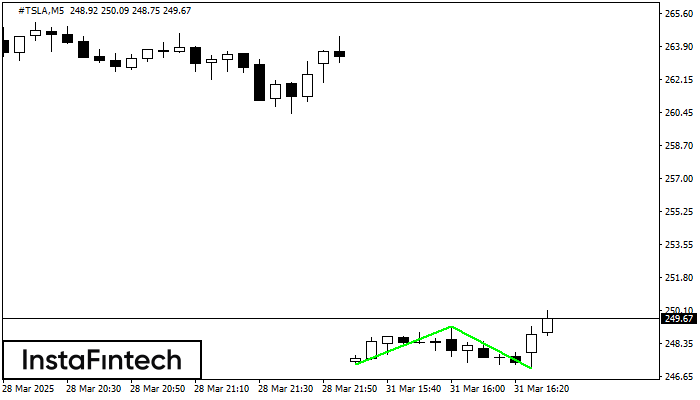
Сформирована фигура «Двойное дно» на графике #TSLA M5. Данное формирование сигнализирует об изменении тенденции с нисходящего на восходящее движение. Сигнал: Торговую позицию на покупку следует открывать после пробоя верхней границы фигуры 249.25, где перспектива будущего хода будет являться шириной текущей фигуры - 198 пунктов.
Таймфреймы М5 и М15 могут иметь больше ложных точек входа.
Shuningdek ko'ring
- Все
- Все
- Bearish Rectangle
- Bearish Symmetrical Triangle
- Bearish Symmetrical Triangle
- Bullish Rectangle
- Double Top
- Double Top
- Triple Bottom
- Triple Bottom
- Triple Top
- Triple Top
- Все
- Все
- Покупка
- Продажа
- Все
- 1
- 2
- 3
- 4
- 5
Triple Top
сформирован 18.04 в 17:45:14 (UTC+0)
сила сигнала 2 из 5
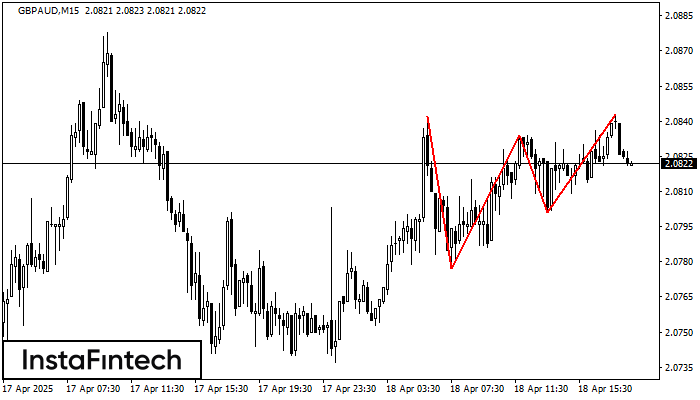
The Triple Top pattern has formed on the chart of the GBPAUD M15 trading instrument. It is a reversal pattern featuring the following characteristics: resistance level -1, support level -24
The M5 and M15 time frames may have more false entry points.
Открыть график инструмента в новом окне
Triple Top
сформирован 18.04 в 17:30:31 (UTC+0)
сила сигнала 3 из 5
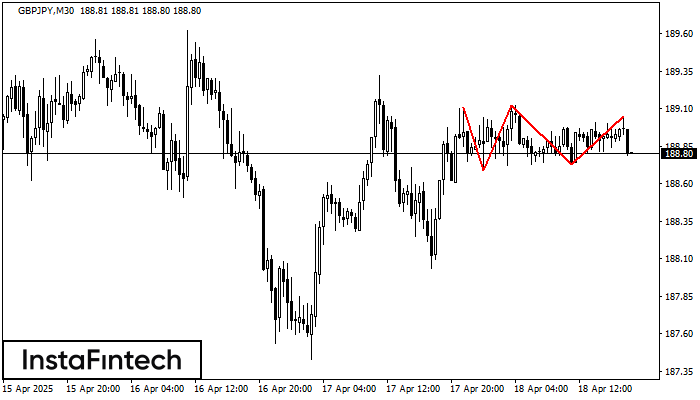
On the chart of the GBPJPY M30 trading instrument, the Triple Top pattern that signals a trend change has formed. It is possible that after formation of the third peak
Открыть график инструмента в новом окне
Triple Bottom
сформирован 18.04 в 16:45:15 (UTC+0)
сила сигнала 2 из 5
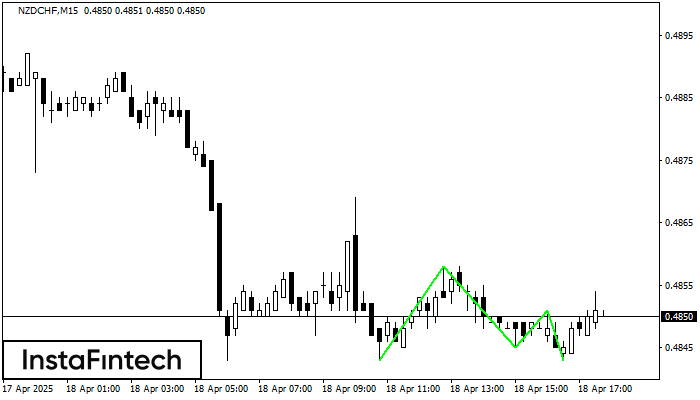
The Triple Bottom pattern has formed on the chart of the NZDCHF M15 trading instrument. The pattern signals a change in the trend from downwards to upwards in the case
The M5 and M15 time frames may have more false entry points.
Открыть график инструмента в новом окне


