

Dolzarb patternlar

Бычий вымпел
сформирован 31.03 в 14:24:54 (UTC+0)
сила сигнала 1 из 5
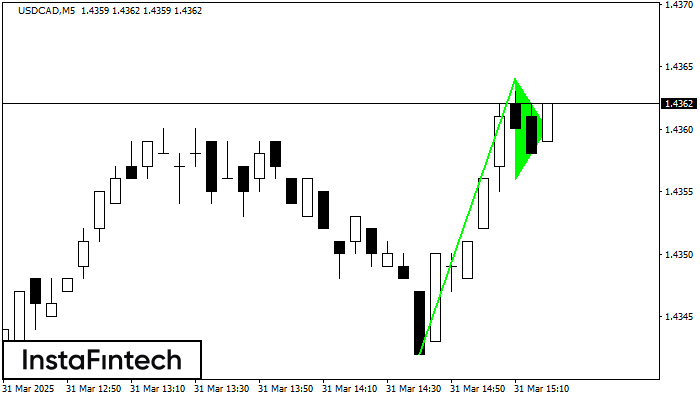
На графике USDCAD M5 сформировался паттерн «Бычий вымпел», который относится к фигуре продолжения тренда. Можно предполагать, что, в случае фиксации цены выше максимума вымпела 1.4364, возможно дальнейшее восходящее движение.
Таймфреймы М5 и М15 могут иметь больше ложных точек входа.
- Все
- Все
- Bearish Rectangle
- Bearish Symmetrical Triangle
- Bearish Symmetrical Triangle
- Bullish Rectangle
- Double Top
- Double Top
- Triple Bottom
- Triple Bottom
- Triple Top
- Triple Top
- Все
- Все
- Покупка
- Продажа
- Все
- 1
- 2
- 3
- 4
- 5
Head and Shoulders
was formed on 18.04 at 18:05:18 (UTC+0)
signal strength 1 of 5

The EURJPY M5 formed the Head and Shoulders pattern with the following features: The Head’s top is at 162.14, the Neckline and the upward angle are at 161.98/161.96. The formation
The M5 and M15 time frames may have more false entry points.
Open chart in a new window
Double Bottom
was formed on 18.04 at 18:05:13 (UTC+0)
signal strength 1 of 5
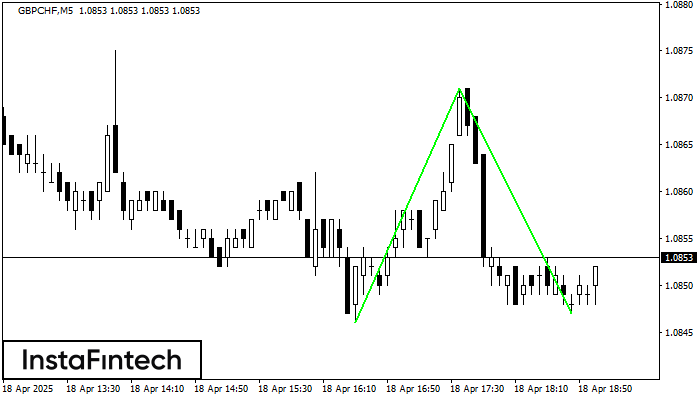
The Double Bottom pattern has been formed on GBPCHF M5. This formation signals a reversal of the trend from downwards to upwards. The signal is that a buy trade should
The M5 and M15 time frames may have more false entry points.
Open chart in a new window
Triple Top
was formed on 18.04 at 18:00:33 (UTC+0)
signal strength 3 of 5
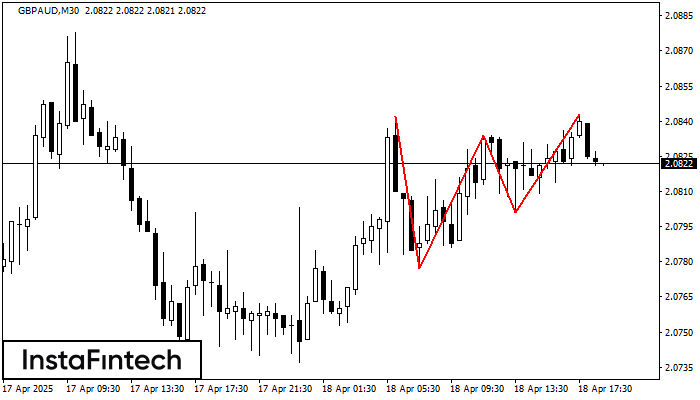
The Triple Top pattern has formed on the chart of the GBPAUD M30. Features of the pattern: borders have an ascending angle; the lower line of the pattern
Open chart in a new window


