

Dolzarb patternlar

Двойное дно
сформирован 28.03 в 12:09:57 (UTC+0)
сила сигнала 1 из 5
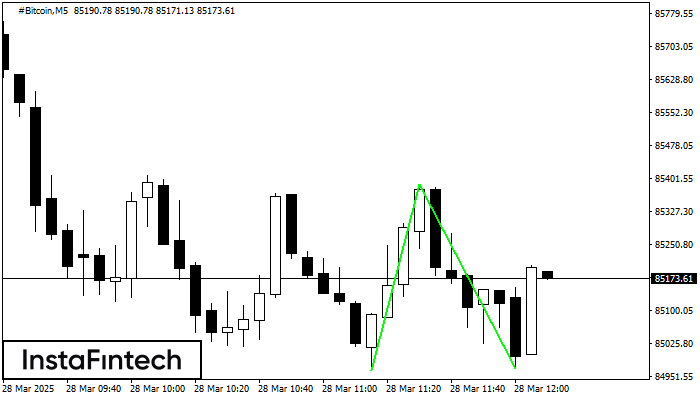
Сформирована фигура «Двойное дно» на графике #Bitcoin M5. Верхняя граница 85387.82; Нижняя граница 84969.24; Ширина фигуры 42309 пунктов. В случае пробоя верхней границы 85387.82 можно будет прогнозировать изменение тенденции, где ширина фигуры и будет являться расстоянием предположительного Тейк Профита.
Таймфреймы М5 и М15 могут иметь больше ложных точек входа.
Shuningdek ko'ring
- Все
- Все
- Bearish Rectangle
- Bearish Symmetrical Triangle
- Bearish Symmetrical Triangle
- Bullish Rectangle
- Double Top
- Double Top
- Triple Bottom
- Triple Bottom
- Triple Top
- Triple Top
- Все
- Все
- Покупка
- Продажа
- Все
- 1
- 2
- 3
- 4
- 5
Double Bottom
сформирован 18.04 в 19:15:27 (UTC+0)
сила сигнала 2 из 5
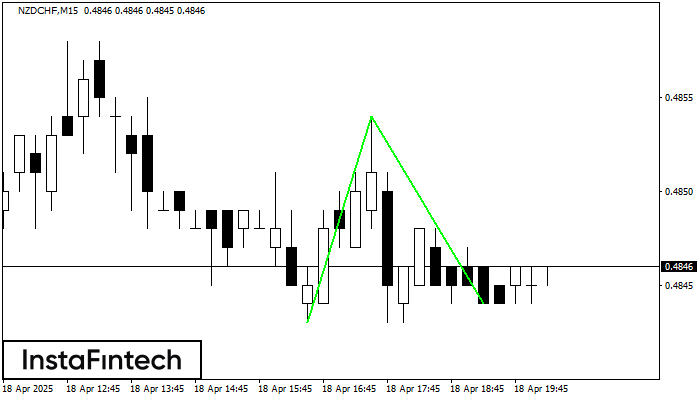
The Double Bottom pattern has been formed on NZDCHF M15; the upper boundary is 0.4854; the lower boundary is 0.4844. The width of the pattern is 11 points. In case
The M5 and M15 time frames may have more false entry points.
Открыть график инструмента в новом окне
Double Bottom
сформирован 18.04 в 18:15:46 (UTC+0)
сила сигнала 2 из 5

The Double Bottom pattern has been formed on GBPCHF M15. This formation signals a reversal of the trend from downwards to upwards. The signal is that a buy trade should
The M5 and M15 time frames may have more false entry points.
Открыть график инструмента в новом окне
Head and Shoulders
сформирован 18.04 в 18:05:18 (UTC+0)
сила сигнала 1 из 5

The EURJPY M5 formed the Head and Shoulders pattern with the following features: The Head’s top is at 162.14, the Neckline and the upward angle are at 161.98/161.96. The formation
The M5 and M15 time frames may have more false entry points.
Открыть график инструмента в новом окне


