

Dolzarb patternlar

Двойное дно
сформирован 25.03 в 13:01:07 (UTC+0)
сила сигнала 4 из 5
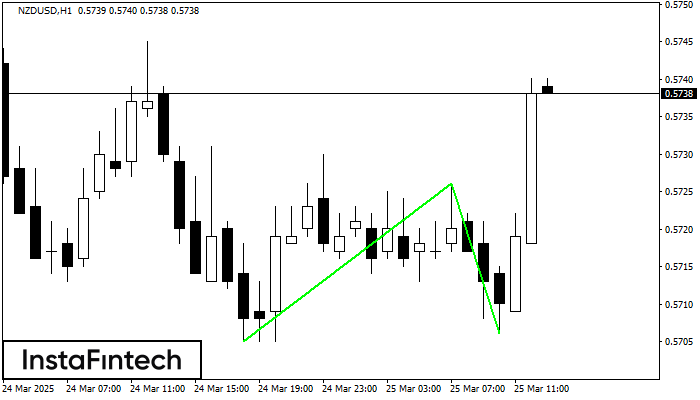
Сформирована фигура «Двойное дно» на графике NZDUSD H1. Характеристика: Уровень поддержки 0.5705; Уровень сопротивления 0.5726; Ширина фигуры 21 пунктов. В случае пробоя уровня сопротивления можно будет прогнозировать изменение тенденции, где первая точка фиксации прибыли находится на расстоянии 20 пунктов.
Shuningdek ko'ring
- Все
- Все
- Bearish Rectangle
- Bearish Symmetrical Triangle
- Bearish Symmetrical Triangle
- Bullish Rectangle
- Double Top
- Double Top
- Triple Bottom
- Triple Bottom
- Triple Top
- Triple Top
- Все
- Все
- Покупка
- Продажа
- Все
- 1
- 2
- 3
- 4
- 5
Bearish pennant
was formed on 31.03 at 16:26:39 (UTC+0)
signal strength 2 of 5
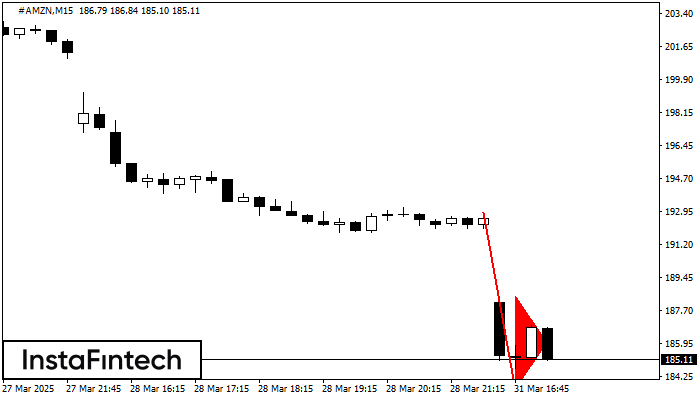
The Bearish pennant pattern has formed on the #AMZN M15 chart. The pattern signals continuation of the downtrend in case the pennant’s low of 183.52 is broken through. Recommendations: Place
The M5 and M15 time frames may have more false entry points.
Open chart in a new window
Double Top
was formed on 31.03 at 16:25:20 (UTC+0)
signal strength 1 of 5
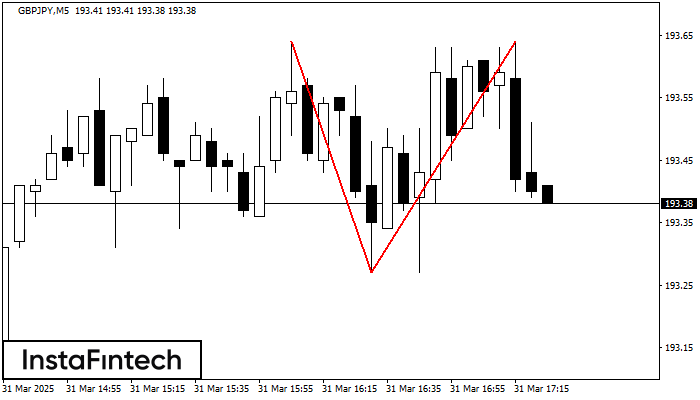
The Double Top reversal pattern has been formed on GBPJPY M5. Characteristics: the upper boundary 193.64; the lower boundary 193.27; the width of the pattern is 37 points. Sell trades
The M5 and M15 time frames may have more false entry points.
Open chart in a new window
Bullish pennant
was formed on 31.03 at 16:18:54 (UTC+0)
signal strength 1 of 5
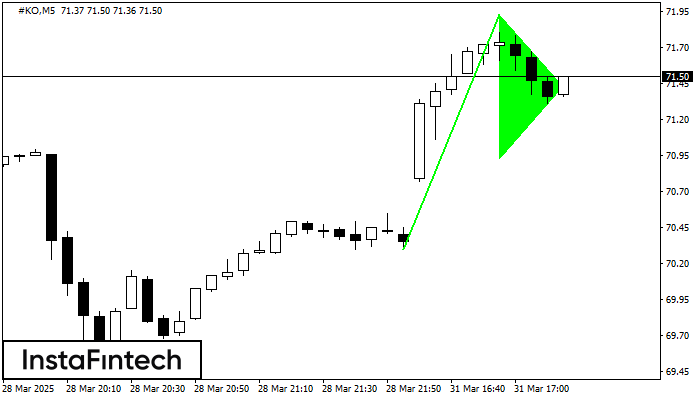
The Bullish pennant signal – Trading instrument #KO M5, continuation pattern. Forecast: it is possible to set up a buy position above the pattern’s high of 71.93, with the prospect
The M5 and M15 time frames may have more false entry points.
Open chart in a new window


