

Dolzarb patternlar

Тройное дно
сформирован 24.03 в 20:25:19 (UTC+0)
сила сигнала 1 из 5
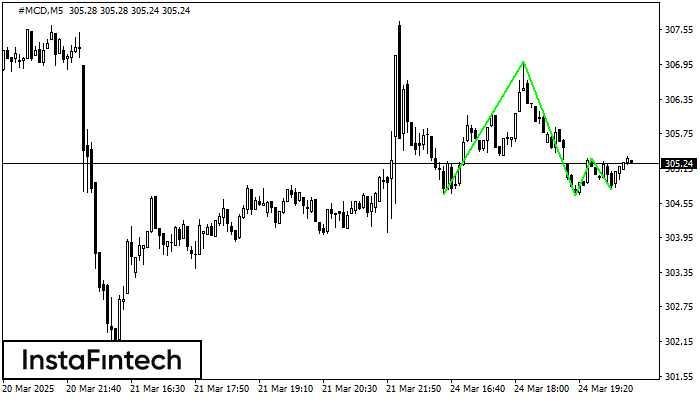
Сформирована фигура «Тройное дно» по торговому инструменту #MCD на M5. Фигура сигнализирует об изменении тенденции с нисходящей на восходящую в случае пробоя верхней границы 305.33.
Таймфреймы М5 и М15 могут иметь больше ложных точек входа.
- Все
- Все
- Bearish Rectangle
- Bearish Symmetrical Triangle
- Bearish Symmetrical Triangle
- Bullish Rectangle
- Double Top
- Double Top
- Triple Bottom
- Triple Bottom
- Triple Top
- Triple Top
- Все
- Все
- Покупка
- Продажа
- Все
- 1
- 2
- 3
- 4
- 5
Double Bottom
сформирован 10.06 в 12:00:33 (UTC+0)
сила сигнала 2 из 5
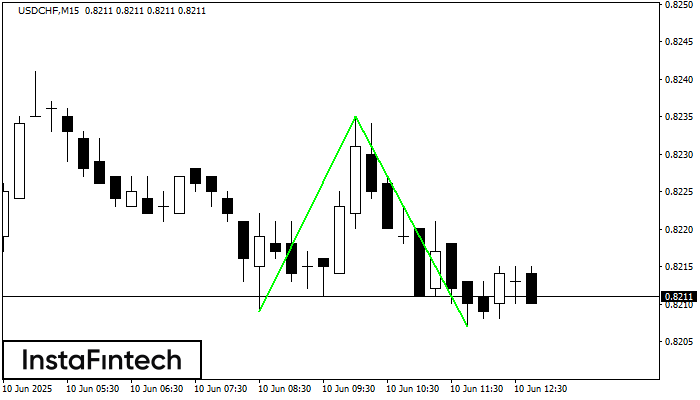
The Double Bottom pattern has been formed on USDCHF M15; the upper boundary is 0.8235; the lower boundary is 0.8207. The width of the pattern is 26 points. In case
The M5 and M15 time frames may have more false entry points.
Открыть график инструмента в новом окне
Triple Bottom
сформирован 10.06 в 11:40:23 (UTC+0)
сила сигнала 1 из 5
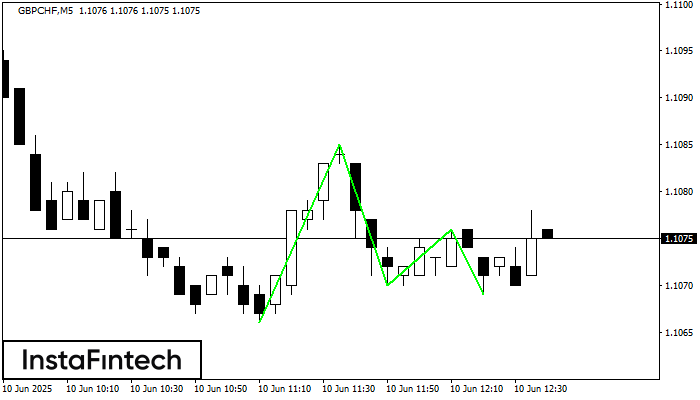
The Triple Bottom pattern has formed on the chart of the GBPCHF M5 trading instrument. The pattern signals a change in the trend from downwards to upwards in the case
The M5 and M15 time frames may have more false entry points.
Открыть график инструмента в новом окне
Double Top
сформирован 10.06 в 11:31:01 (UTC+0)
сила сигнала 1 из 5
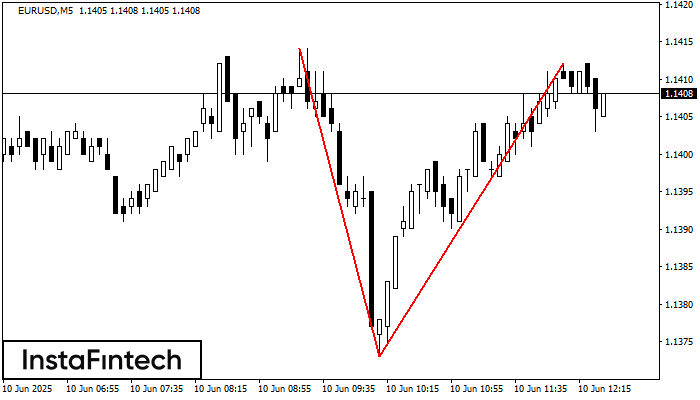
On the chart of EURUSD M5 the Double Top reversal pattern has been formed. Characteristics: the upper boundary 1.1412; the lower boundary 1.1373; the width of the pattern 39 points
The M5 and M15 time frames may have more false entry points.
Открыть график инструмента в новом окне


