

Dolzarb patternlar

Прямоугольник
сформирован 24.03 в 19:11:46 (UTC+0)
сила сигнала 1 из 5
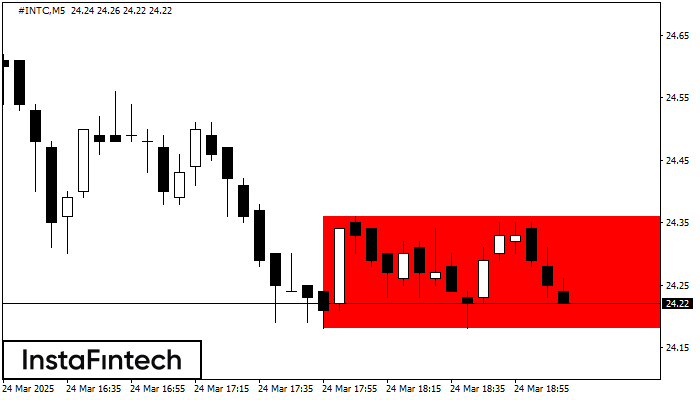
Сформирована фигура «Прямоугольник» на графике #INTC M5. Тип фигуры: Продолжение тренда; Границы: Верхняя 24.36, Нижняя 24.18; Сигнал: позиция на продажу открывается после фиксации цены ниже границы прямоугольника 24.18.
Таймфреймы М5 и М15 могут иметь больше ложных точек входа.
- Все
- Все
- Bearish Rectangle
- Bearish Symmetrical Triangle
- Bearish Symmetrical Triangle
- Bullish Rectangle
- Double Top
- Double Top
- Triple Bottom
- Triple Bottom
- Triple Top
- Triple Top
- Все
- Все
- Покупка
- Продажа
- Все
- 1
- 2
- 3
- 4
- 5
Double Bottom
сформирован 14.06 в 21:00:24 (UTC+0)
сила сигнала 1 из 5
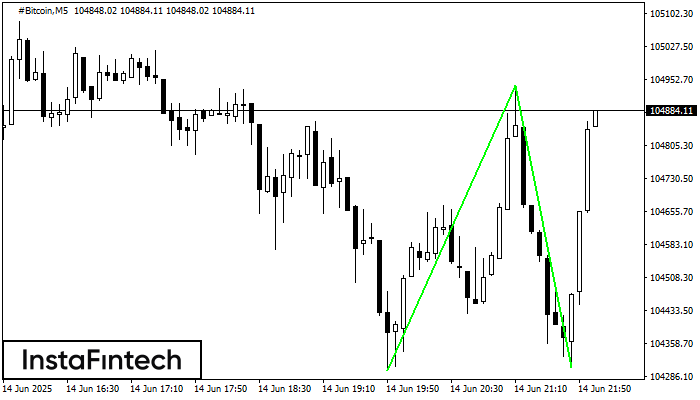
The Double Bottom pattern has been formed on #Bitcoin M5. Characteristics: the support level 104299.16; the resistance level 104939.96; the width of the pattern 64080 points. If the resistance level
The M5 and M15 time frames may have more false entry points.
Открыть график инструмента в новом окне
Double Bottom
сформирован 14.06 в 15:14:48 (UTC+0)
сила сигнала 2 из 5

The Double Bottom pattern has been formed on #Bitcoin M15. Characteristics: the support level 104607.76; the resistance level 106173.71; the width of the pattern 156595 points. If the resistance level
The M5 and M15 time frames may have more false entry points.
Открыть график инструмента в новом окне
Triple Bottom
сформирован 13.06 в 22:45:28 (UTC+0)
сила сигнала 1 из 5

The Triple Bottom pattern has formed on the chart of AUDCHF M5. Features of the pattern: The lower line of the pattern has coordinates 0.5269 with the upper limit 0.5269/0.5268
The M5 and M15 time frames may have more false entry points.
Открыть график инструмента в новом окне


