

Dolzarb patternlar

Актуальные паттерны
- Все
- Все
- Bearish Rectangle
- Bearish Symmetrical Triangle
- Bearish Symmetrical Triangle
- Bullish Rectangle
- Double Top
- Double Top
- Triple Bottom
- Triple Bottom
- Triple Top
- Triple Top
- Все
- Все
- Покупка
- Продажа
- Все
- 1
- 2
- 3
- 4
- 5
Bearish Symmetrical Triangle
сформирован 17.04 в 21:00:18 (UTC+0)
сила сигнала 2 из 5
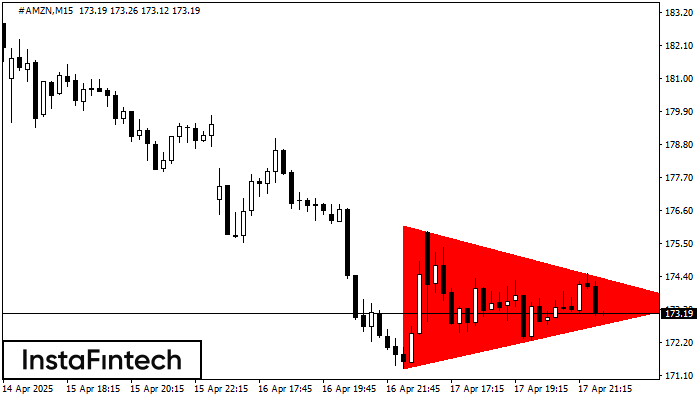
According to the chart of M15, #AMZN formed the Bearish Symmetrical Triangle pattern. Trading recommendations: A breach of the lower border 171.36 is likely to encourage a continuation
The M5 and M15 time frames may have more false entry points.
Открыть график инструмента в новом окне
Double Top
сформирован 17.04 в 20:50:23 (UTC+0)
сила сигнала 1 из 5
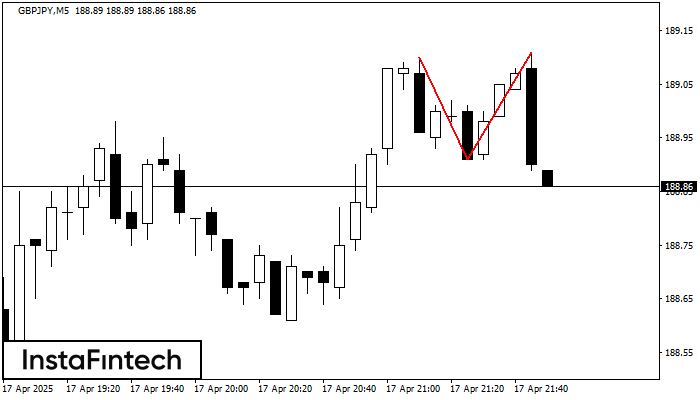
The Double Top reversal pattern has been formed on GBPJPY M5. Characteristics: the upper boundary 189.10; the lower boundary 188.91; the width of the pattern is 20 points. Sell trades
The M5 and M15 time frames may have more false entry points.
Открыть график инструмента в новом окне
Double Bottom
сформирован 17.04 в 20:20:19 (UTC+0)
сила сигнала 1 из 5

The Double Bottom pattern has been formed on EURNZD M5. Characteristics: the support level 1.8992; the resistance level 1.9020; the width of the pattern 28 points. If the resistance level
The M5 and M15 time frames may have more false entry points.
Открыть график инструмента в новом окне
Double Top
сформирован 17.04 в 19:47:53 (UTC+0)
сила сигнала 2 из 5
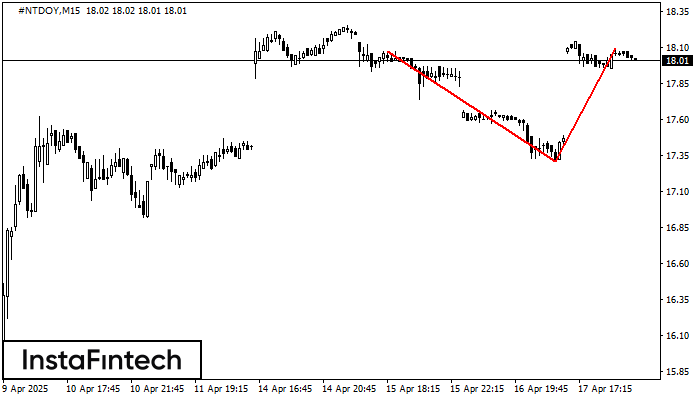
The Double Top reversal pattern has been formed on #NTDOY M15. Characteristics: the upper boundary 18.07; the lower boundary 17.31; the width of the pattern is 78 points. Sell trades
The M5 and M15 time frames may have more false entry points.
Открыть график инструмента в новом окне
Bullish pennant
сформирован 17.04 в 19:46:18 (UTC+0)
сила сигнала 2 из 5

The Bullish pennant pattern is formed on the AUDJPY M15 chart. It is a type of the continuation pattern. Supposedly, in case the price is fixed above the pennant’s high
The M5 and M15 time frames may have more false entry points.
Открыть график инструмента в новом окне
Bullish Symmetrical Triangle
сформирован 17.04 в 19:29:20 (UTC+0)
сила сигнала 1 из 5

According to the chart of M5, #PEP formed the Bullish Symmetrical Triangle pattern. Description: This is the pattern of a trend continuation. 142.99 and 142.53 are the coordinates
The M5 and M15 time frames may have more false entry points.
Открыть график инструмента в новом окне
Bullish Symmetrical Triangle
сформирован 17.04 в 19:29:11 (UTC+0)
сила сигнала 1 из 5
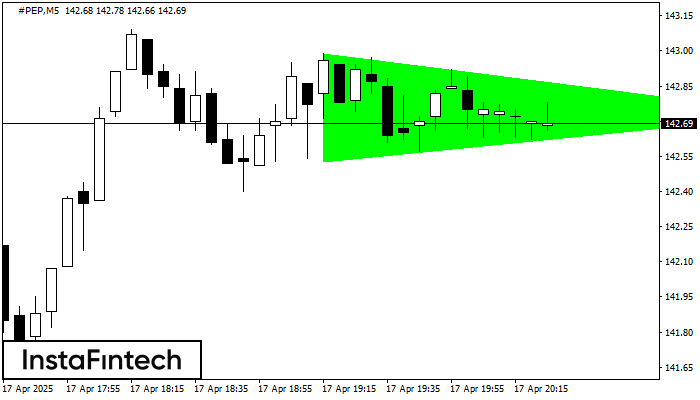
According to the chart of M5, #PEP formed the Bullish Symmetrical Triangle pattern. The lower border of the pattern touches the coordinates 142.53/142.73 whereas the upper border goes across 142.99/142.73
The M5 and M15 time frames may have more false entry points.
Открыть график инструмента в новом окне
Double Top
сформирован 17.04 в 19:25:16 (UTC+0)
сила сигнала 1 из 5
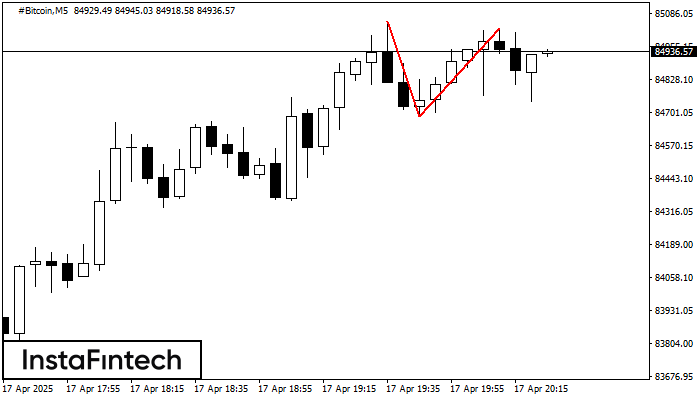
The Double Top reversal pattern has been formed on #Bitcoin M5. Characteristics: the upper boundary 85053.67; the lower boundary 84685.87; the width of the pattern is 33901 points. Sell trades
The M5 and M15 time frames may have more false entry points.
Открыть график инструмента в новом окне
Double Top
сформирован 17.04 в 19:20:46 (UTC+0)
сила сигнала 1 из 5
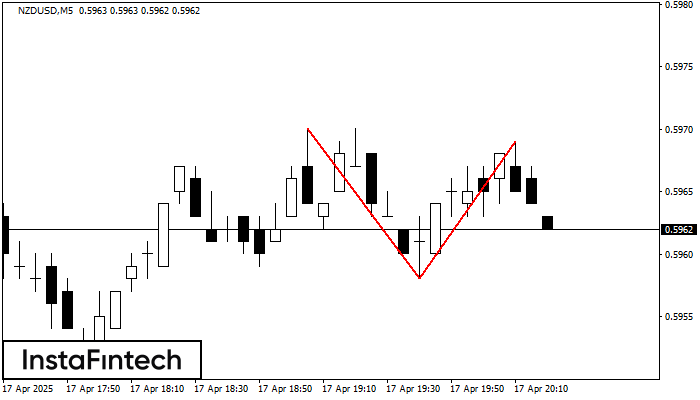
The Double Top reversal pattern has been formed on NZDUSD M5. Characteristics: the upper boundary 0.5970; the lower boundary 0.5958; the width of the pattern is 11 points. Sell trades
The M5 and M15 time frames may have more false entry points.
Открыть график инструмента в новом окне


