

Актуальні патерни

Патерни - це графічні моделі, які "малюють" ціни на графіку. Один з постулатів технічного аналізу говорить нам про те, що історія (рух ціни) завжди повторюється. Це означає, що в схожих ситуаціях рух ціни, найчастіше, буде схожим, що дозволяє з високою часткою ймовірності спрогнозувати подальший розвиток ситуації.
Актуальні патерни від ІнстаФорекс - це зручний сервіс, який дозволить вам завжди бути в курсі останніх змін на ринку і вчасно реагувати на підказки, що з'явилися, від ринку. У нашому сервісі ви завжди знайдете найсвіжіші і актуальніші патерни на будь-якій парі і на будь-якому таймфреймі.
Тройное дно
сформирован 18.04 в 20:00:30 (UTC+0)
сила сигнала 3 из 5
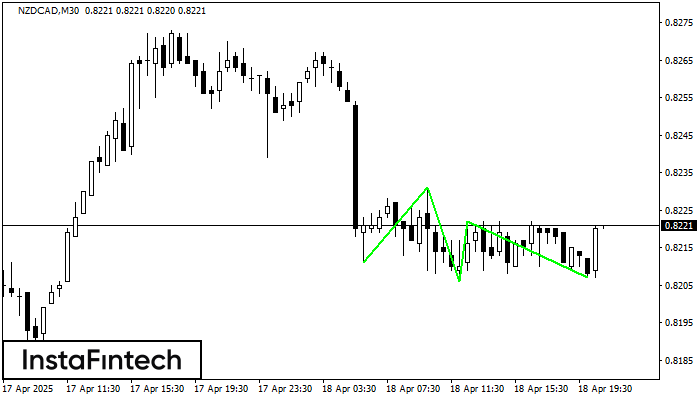
Сформирована фигура «Тройное дно» по торговому инструменту NZDCAD на M30. Фигура сигнализирует об изменении тенденции с нисходящей на восходящую в случае пробоя верхней границы 0.8222.
Дивіться також
- Все
- Все
- Bearish Rectangle
- Bearish Symmetrical Triangle
- Bearish Symmetrical Triangle
- Bullish Rectangle
- Double Top
- Double Top
- Triple Bottom
- Triple Bottom
- Triple Top
- Triple Top
- Все
- Все
- Покупка
- Продажа
- Все
- 1
- 2
- 3
- 4
- 5
Bearish Symmetrical Triangle
was formed on 05.06 at 00:09:22 (UTC+0)
signal strength 1 of 5
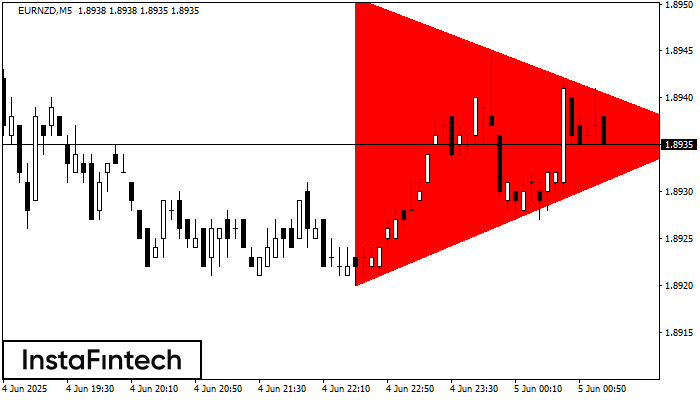
According to the chart of M5, EURNZD formed the Bearish Symmetrical Triangle pattern. Trading recommendations: A breach of the lower border 1.8920 is likely to encourage a continuation
The M5 and M15 time frames may have more false entry points.
Open chart in a new window
Double Bottom
was formed on 04.06 at 23:40:22 (UTC+0)
signal strength 1 of 5
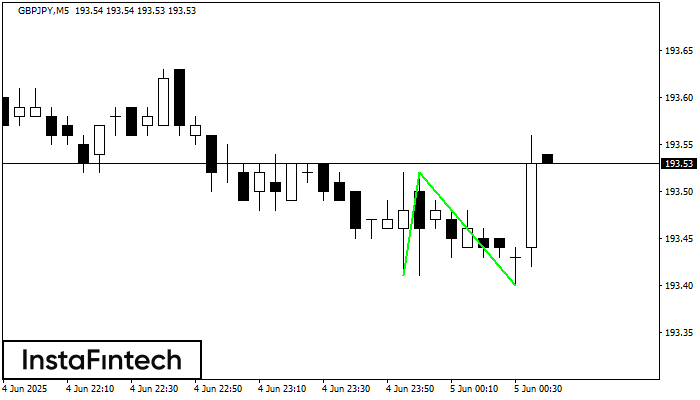
The Double Bottom pattern has been formed on GBPJPY M5. This formation signals a reversal of the trend from downwards to upwards. The signal is that a buy trade should
The M5 and M15 time frames may have more false entry points.
Open chart in a new window
Double Bottom
was formed on 04.06 at 23:15:29 (UTC+0)
signal strength 2 of 5
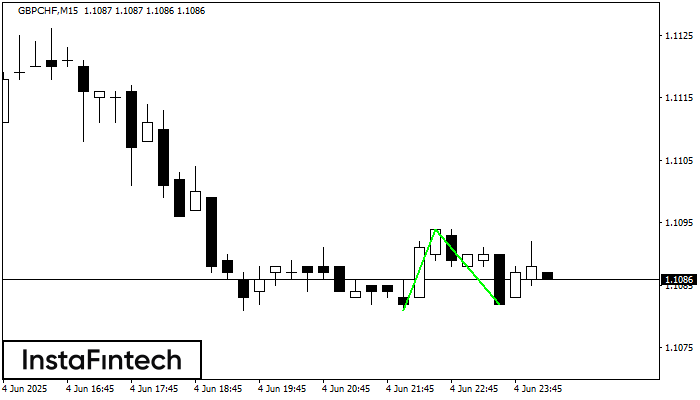
The Double Bottom pattern has been formed on GBPCHF M15. Characteristics: the support level 1.1081; the resistance level 1.1094; the width of the pattern 13 points. If the resistance level
The M5 and M15 time frames may have more false entry points.
Open chart in a new window


