

Актуальні патерни

Патерни - це графічні моделі, які "малюють" ціни на графіку. Один з постулатів технічного аналізу говорить нам про те, що історія (рух ціни) завжди повторюється. Це означає, що в схожих ситуаціях рух ціни, найчастіше, буде схожим, що дозволяє з високою часткою ймовірності спрогнозувати подальший розвиток ситуації.
Актуальні патерни від ІнстаФорекс - це зручний сервіс, який дозволить вам завжди бути в курсі останніх змін на ринку і вчасно реагувати на підказки, що з'явилися, від ринку. У нашому сервісі ви завжди знайдете найсвіжіші і актуальніші патерни на будь-якій парі і на будь-якому таймфреймі.
Двойная вершина
сформирован 18.04 в 04:00:48 (UTC+0)
сила сигнала 3 из 5
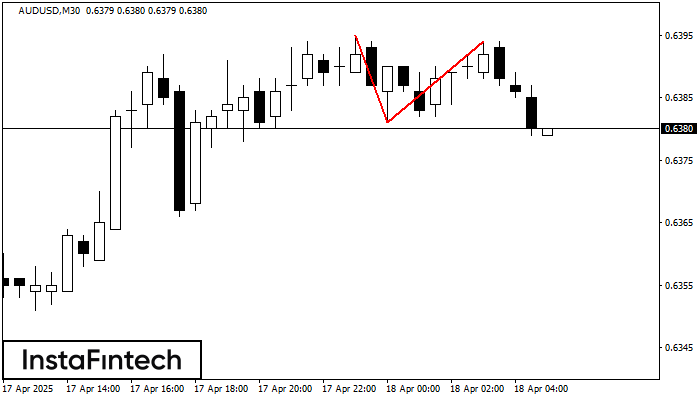
На торговом графике AUDUSD M30 сформировалась разворотная фигура «Двойная вершина». Характеристика: Верхняя граница 0.6394; Нижняя граница 0.6381; Ширина фигуры 13 пунктов. Сигнал: Пробой нижней границы 0.6381 приведет к дальнейшему нисходящему движению с перспективой хода к уровню 0.6351.
Дивіться також
- Все
- Все
- Bearish Rectangle
- Bearish Symmetrical Triangle
- Bearish Symmetrical Triangle
- Bullish Rectangle
- Double Top
- Double Top
- Triple Bottom
- Triple Bottom
- Triple Top
- Triple Top
- Все
- Все
- Покупка
- Продажа
- Все
- 1
- 2
- 3
- 4
- 5
Head and Shoulders
was formed on 10.06 at 06:45:33 (UTC+0)
signal strength 2 of 5
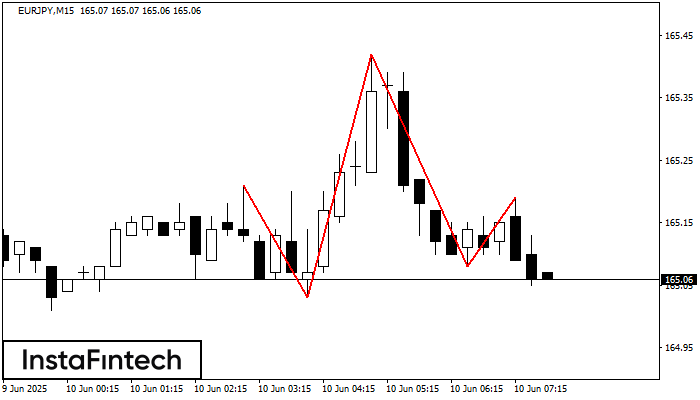
The technical pattern called Head and Shoulders has appeared on the chart of EURJPY M15. There are weighty reasons to suggest that the price will surpass the Neckline 165.03/165.08 after
The M5 and M15 time frames may have more false entry points.
Open chart in a new window
Triple Bottom
was formed on 10.06 at 06:35:10 (UTC+0)
signal strength 1 of 5
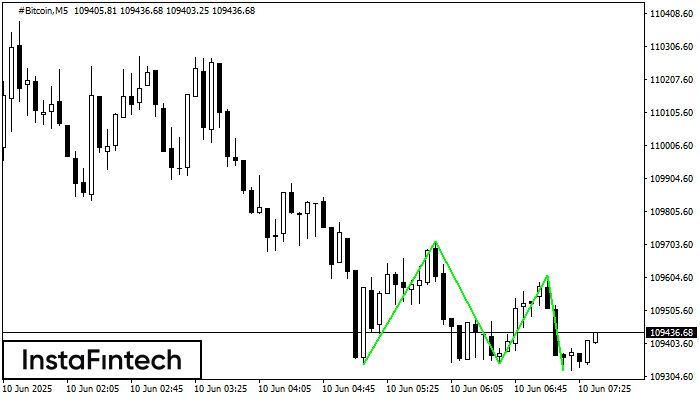
The Triple Bottom pattern has formed on the chart of the #Bitcoin M5 trading instrument. The pattern signals a change in the trend from downwards to upwards in the case
The M5 and M15 time frames may have more false entry points.
Open chart in a new window
Head and Shoulders
was formed on 10.06 at 06:30:11 (UTC+0)
signal strength 1 of 5
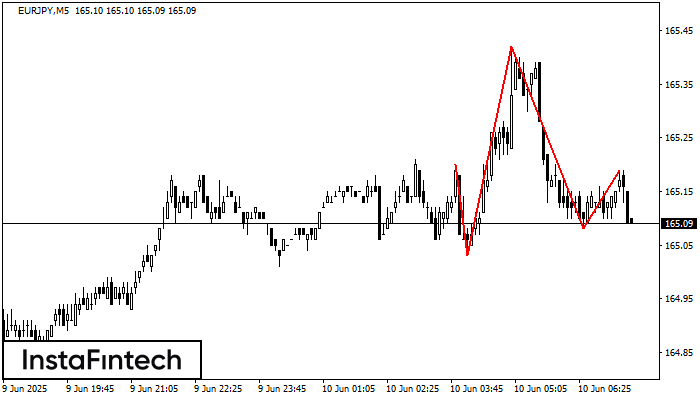
According to the chart of M5, EURJPY formed the Head and Shoulders pattern. The Head’s top is set at 165.42 while the median line of the Neck is found
The M5 and M15 time frames may have more false entry points.
Open chart in a new window


