

รูปแบบกราฟ

รูปแบบกราฟนั้นเป็น รูปจำลองทางกราฟฟิกที่ถูกสร้างขึ้นมาในชาร์ตจากราคา อ้างอิงตามหนึ่งในการวิเคราะห์ทางเทคนิค ที่ตั้งสมมติฐานมาว่า ประวัติศาสตร์ (การเคลื่อนไหวของราคา) มักจะเกิดขึ้นซ้ำรอยเดิม นั้นหมายความว่า การเคลื่อนไหวของราคาก็หมือนกับ สถานการณ์หนึ่งที่จะสามารถทำการคาดการณ์ไปยังทิศทางในอนาคต ตามเหตุการณ์ที่น่าจะมีความเป็นไปได้สูง
รูปแบบกราฟที่สำคัญจากทาง InstaTrade นั้นจะเป็นการบริการที่มีการใช้อย่างง่ายดาย ซึ่งจะช่วยให้คุณสามารถทราบถึงการเปลี่ยนแปลงล่าสุด ในตลาดได้ และสามารถรับมือกับข้อมูลจากทางตลาดได้ทันท่วงที ในการบริการของพวกเรานั้น คุณจะพบกับรูปแบบกราฟล่าสุดและมีความสำคัญมากที่สุดในทุกๆคู่สกุลเงิน และทุกๆขอบเขตเวลา
Bearish pennant
was formed on 21.04 at 17:59:57 (UTC+0)
signal strength 3 of 5
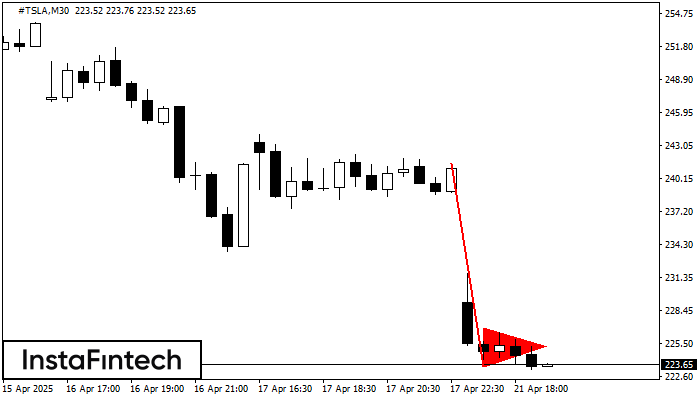
The Bearish pennant pattern has formed on the #TSLA M30 chart. It signals potential continuation of the existing trend. Specifications: the pattern’s bottom has the coordinate of 223.47; the projection of the flagpole height is equal to 1803 pips. In case the price breaks out the pattern’s bottom of 223.47, the downtrend is expected to continue for further level 223.17.
- All
- All
- Bearish Rectangle
- Bearish Symmetrical Triangle
- Bearish Symmetrical Triangle
- Bullish Rectangle
- Double Top
- Double Top
- Triple Bottom
- Triple Bottom
- Triple Top
- Triple Top
- All
- All
- Buy
- Sale
- All
- 1
- 2
- 3
- 4
- 5
รูปแบบกราฟจุดสามยอด (Triple Top)
was formed on 30.04 at 10:25:27 (UTC+0)
signal strength 1 of 5
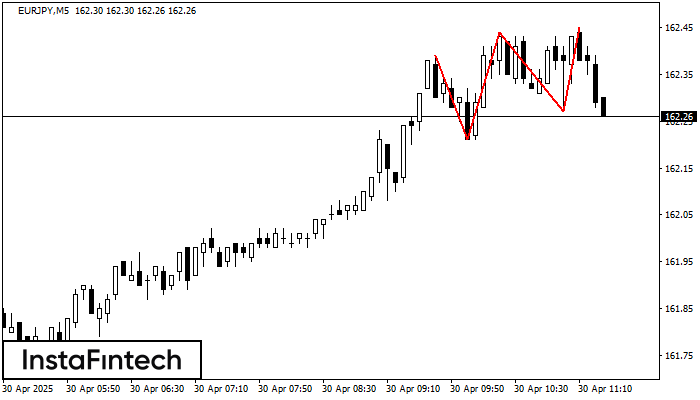
รูปแบบ รูปแบบกราฟจุดสามยอด (Triple Top) ได้สร้างขึ้นมาในชาร์ตของ EURJPY M5 ที่เป็นตราสารการซื้อขาย มันเป็นกราฟรูปแบบกราฟรูปแบบย้อนกลับ ที่มีคุณลักษณะดังต่อไปนี้ : ระดับของแนวต้าน -6, ระดับของแนวรับ -6
ขอบเตระยะเวลาใน M5 และ M15 อาจจะมีตำแหน่งการเข้าใช้งานที่ผิดพลาดมากยิ่งขึ้น
Open chart in a new window
รูปแบบกราฟสี่เหลี่ยมผืนผ้าขาลง (Bearish Rectangle)
was formed on 30.04 at 10:08:30 (UTC+0)
signal strength 2 of 5
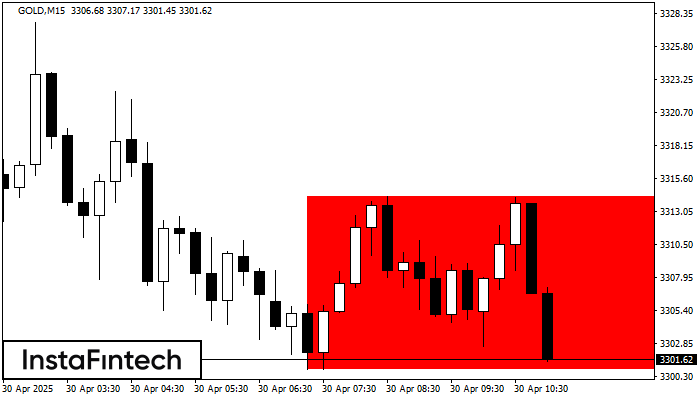
อ้างอิงจากชาร์ตของ M15, GOLD ที่ได้สร้างรูปแบบ รูปแบบกราฟสี่เหลี่ยมผืนผ้าขาลง (Bearish Rectangle) ออกมา รูปแบบนี้แสดงถึง ความต่อเนื่องในแนวโน้ม ขอบเขตด้านบนคือ 3314.24 ส่วนขอบเขตด้านล่างคือ 3300.82 สัญญาณนี้แสดงถึง
ขอบเตระยะเวลาใน M5 และ M15 อาจจะมีตำแหน่งการเข้าใช้งานที่ผิดพลาดมากยิ่งขึ้น
Open chart in a new window
รูปแบบกราฟหัวและหัวไหล่แบบกลับหัว (Inverse Head and Shoulder)
was formed on 30.04 at 09:15:30 (UTC+0)
signal strength 1 of 5
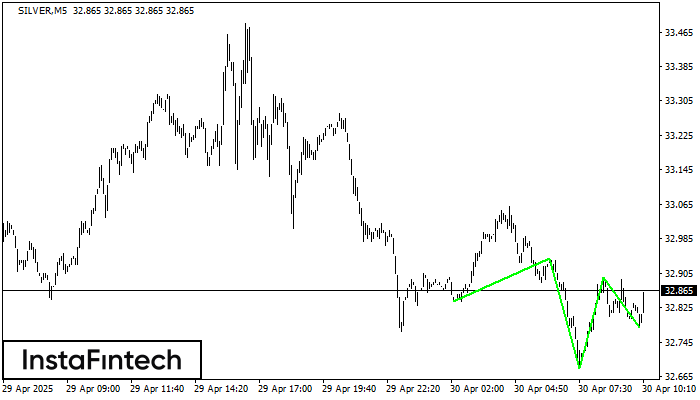
อ้างอิงจาก M5, SILVER กำลังก่อรูปแบบทางเทคนิคขึ้นมา รูปแบบกราฟหัวและหัวไหล่แบบกลับหัว (Inverse Head and Shoulder) ในกรณีที่มีการเคลื่อนตัวทะลุผ่านตำแหน่งคอ 32.94/32.90 ออกไป ตราสารก็อาจจะเคลื่อนตัวไปยัง 32.91
ขอบเตระยะเวลาใน M5 และ M15 อาจจะมีตำแหน่งการเข้าใช้งานที่ผิดพลาดมากยิ่งขึ้น
Open chart in a new window


