

รูปแบบกราฟ

รูปแบบกราฟนั้นเป็น รูปจำลองทางกราฟฟิกที่ถูกสร้างขึ้นมาในชาร์ตจากราคา อ้างอิงตามหนึ่งในการวิเคราะห์ทางเทคนิค ที่ตั้งสมมติฐานมาว่า ประวัติศาสตร์ (การเคลื่อนไหวของราคา) มักจะเกิดขึ้นซ้ำรอยเดิม นั้นหมายความว่า การเคลื่อนไหวของราคาก็หมือนกับ สถานการณ์หนึ่งที่จะสามารถทำการคาดการณ์ไปยังทิศทางในอนาคต ตามเหตุการณ์ที่น่าจะมีความเป็นไปได้สูง
รูปแบบกราฟที่สำคัญจากทาง InstaTrade นั้นจะเป็นการบริการที่มีการใช้อย่างง่ายดาย ซึ่งจะช่วยให้คุณสามารถทราบถึงการเปลี่ยนแปลงล่าสุด ในตลาดได้ และสามารถรับมือกับข้อมูลจากทางตลาดได้ทันท่วงที ในการบริการของพวกเรานั้น คุณจะพบกับรูปแบบกราฟล่าสุดและมีความสำคัญมากที่สุดในทุกๆคู่สกุลเงิน และทุกๆขอบเขตเวลา
Double Top
was formed on 18.04 at 04:00:48 (UTC+0)
signal strength 3 of 5
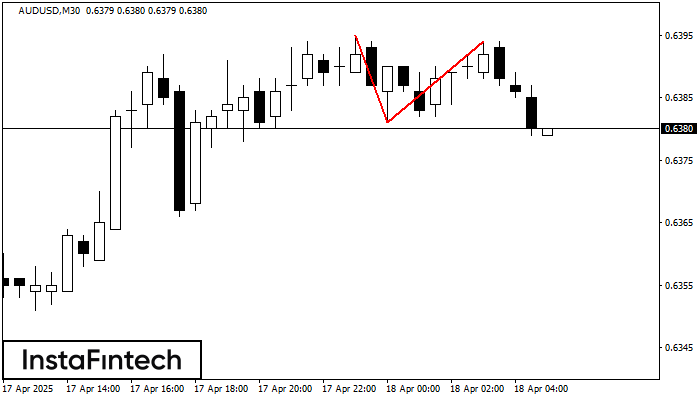
On the chart of AUDUSD M30 the Double Top reversal pattern has been formed. Characteristics: the upper boundary 0.6394; the lower boundary 0.6381; the width of the pattern 13 points. The signal: a break of the lower boundary will cause continuation of the downward trend targeting the 0.6351 level.
ดูเพิ่มเติม
- All
- All
- Bearish Rectangle
- Bearish Symmetrical Triangle
- Bearish Symmetrical Triangle
- Bullish Rectangle
- Double Top
- Double Top
- Triple Bottom
- Triple Bottom
- Triple Top
- Triple Top
- All
- All
- Buy
- Sale
- All
- 1
- 2
- 3
- 4
- 5
Cabeça & Ombros
was formed on 10.06 at 07:59:55 (UTC+0)
signal strength 3 of 5
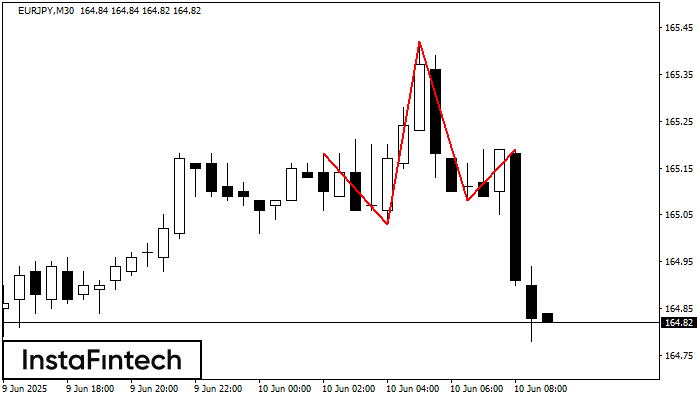
O padrão técnico chamado Cabeça & Ombros apareceu no gráfico de EURJPY M30. Há razões de peso para sugerir que o preço ultrapassará a Linha do Pescoço 165.03/165.08 após
Open chart in a new window
Cabeça & Ombros
was formed on 10.06 at 06:45:33 (UTC+0)
signal strength 2 of 5
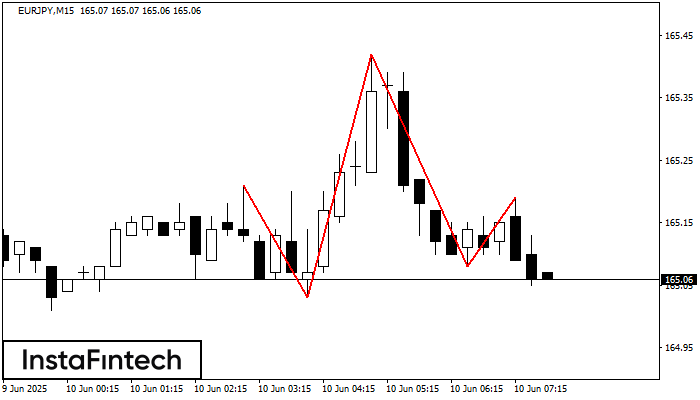
O padrão técnico chamado Cabeça & Ombros apareceu no gráfico de EURJPY M15. Há razões de peso para sugerir que o preço ultrapassará a Linha do Pescoço 165.03/165.08 após
Os intervalos M5 e M15 podem ter mais pontos de entrada falsos.
Open chart in a new window
Fundo triplo
was formed on 10.06 at 06:35:10 (UTC+0)
signal strength 1 of 5
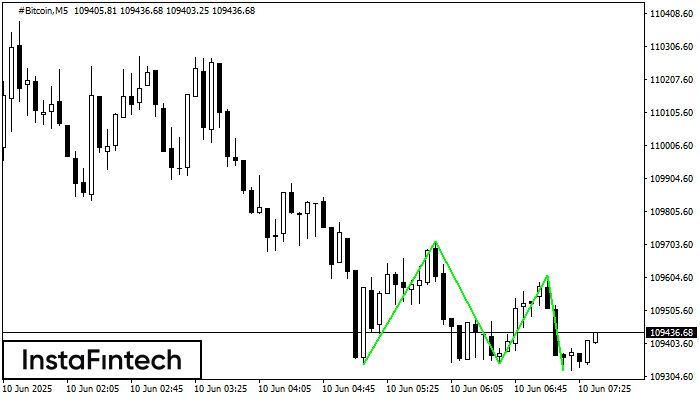
O padrão Fundo triplo foi formado no gráfico do instrumento de negociação #Bitcoin M5. O padrão sinaliza uma mudança na tendência de baixa para alta no caso de quebra
Os intervalos M5 e M15 podem ter mais pontos de entrada falsos.
Open chart in a new window


