

รูปแบบกราฟ

รูปแบบกราฟนั้นเป็น รูปจำลองทางกราฟฟิกที่ถูกสร้างขึ้นมาในชาร์ตจากราคา อ้างอิงตามหนึ่งในการวิเคราะห์ทางเทคนิค ที่ตั้งสมมติฐานมาว่า ประวัติศาสตร์ (การเคลื่อนไหวของราคา) มักจะเกิดขึ้นซ้ำรอยเดิม นั้นหมายความว่า การเคลื่อนไหวของราคาก็หมือนกับ สถานการณ์หนึ่งที่จะสามารถทำการคาดการณ์ไปยังทิศทางในอนาคต ตามเหตุการณ์ที่น่าจะมีความเป็นไปได้สูง
รูปแบบกราฟที่สำคัญจากทาง InstaTrade นั้นจะเป็นการบริการที่มีการใช้อย่างง่ายดาย ซึ่งจะช่วยให้คุณสามารถทราบถึงการเปลี่ยนแปลงล่าสุด ในตลาดได้ และสามารถรับมือกับข้อมูลจากทางตลาดได้ทันท่วงที ในการบริการของพวกเรานั้น คุณจะพบกับรูปแบบกราฟล่าสุดและมีความสำคัญมากที่สุดในทุกๆคู่สกุลเงิน และทุกๆขอบเขตเวลา
Bearish Rectangle
was formed on 08.04 at 05:46:20 (UTC+0)
signal strength 1 of 5
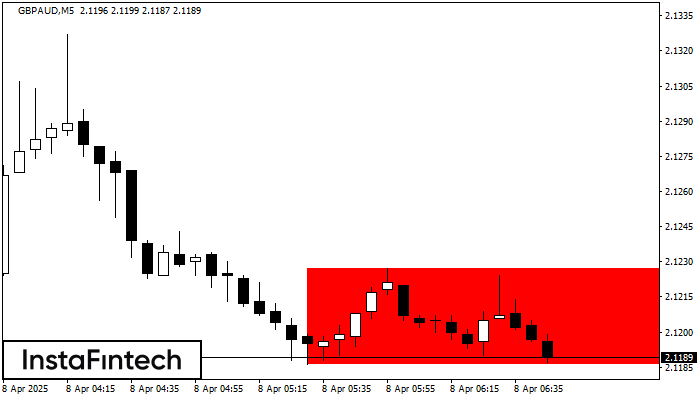
According to the chart of M5, GBPAUD formed the Bearish Rectangle. The pattern indicates a trend continuation. The upper border is 2.1227, the lower border is 2.1186. The signal means that a short position should be opened after fixing a price below the lower border 2.1186 of the Bearish Rectangle.
The M5 and M15 time frames may have more false entry points.
ดูเพิ่มเติม
- All
- All
- Bearish Rectangle
- Bearish Symmetrical Triangle
- Bearish Symmetrical Triangle
- Bullish Rectangle
- Double Top
- Double Top
- Triple Bottom
- Triple Bottom
- Triple Top
- Triple Top
- All
- All
- Buy
- Sale
- All
- 1
- 2
- 3
- 4
- 5
รูปแบบกราฟจุดสองยอดขาลง (Double Bottom)
was formed on 04.06 at 10:00:11 (UTC+0)
signal strength 4 of 5
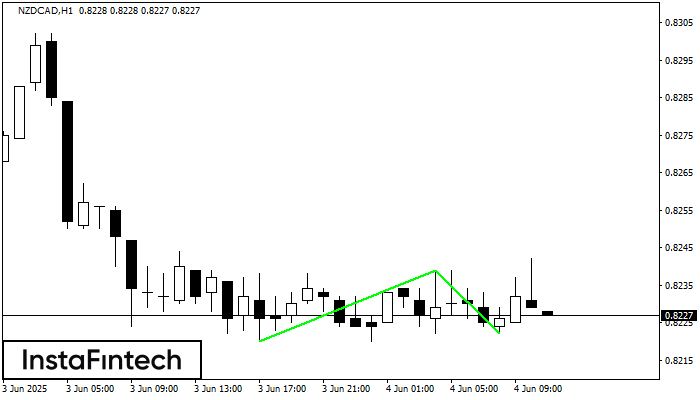
รูปแบบ รูปแบบกราฟจุดสองยอดขาลง (Double Bottom) ถูกสร้างขึ้นมาใน NZDCAD H1; ขอบเขตด้านบนอยู่ที่ 0.8239;ขอบเขตด้านล่าง คือ 0.8222 ความกว้างของรูปแบบนี้คือ 19 จุด กรณีที่มีการเคลื่อนตัวทะลุผ่านขอบเขตด้านบน
Open chart in a new window
รูปแบบกราฟจุดสองยอด (Double Top)
was formed on 04.06 at 10:00:01 (UTC+0)
signal strength 4 of 5
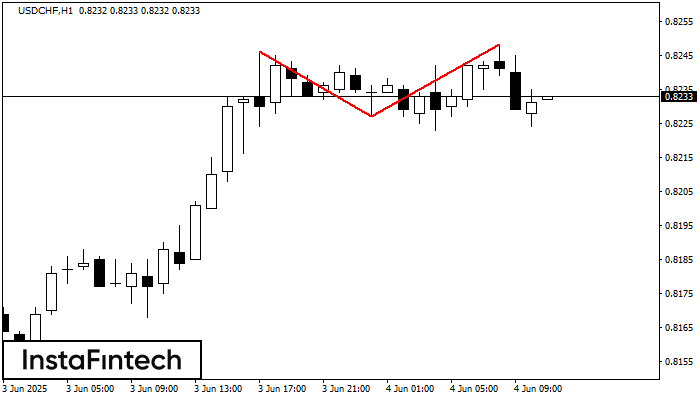
รูปแบบการย้อนตัว รูปแบบกราฟจุดสองยอด (Double Top) ได้ถูกสร้างขึ้นมาใน USDCHF H1 คุณลักษณะ: ขอบเขตด้านบน 0.8246; ขอบเขตด้านล่าง 0.8227; ความกว้างของกราฟรูปแบบนี้คือ 21 จุด
Open chart in a new window
รูปแบบกราฟสี่เหลี่ยมผืนผ้าขาขึ้น (Bullish Rectangle)
was formed on 04.06 at 09:59:16 (UTC+0)
signal strength 3 of 5
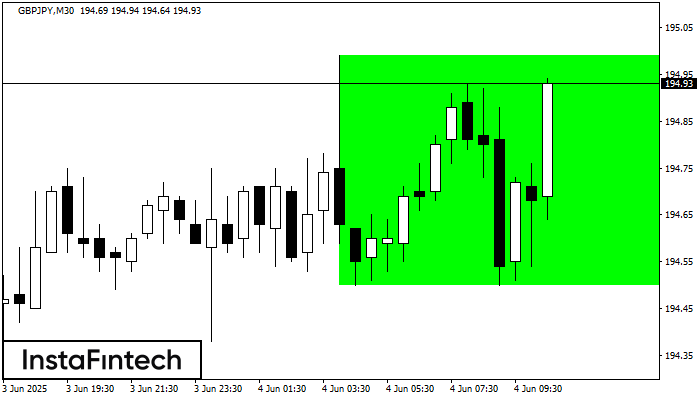
อ้างอิงจากชาร์ตของ M30, GBPJPY ที่ได้สร้างรูปแบบ รูปแบบกราฟสี่เหลี่ยมผืนผ้าขาขึ้น (Bullish Rectangle) ออกมา รูปแบบนี้แสดงถึง ความต่อเนื่องในแนวโน้ม ขอบเขตด้านบนคือ 194.99 ส่วน ขอบเขตด้านล่างคือ 194.50
Open chart in a new window


