

รูปแบบกราฟ

รูปแบบกราฟนั้นเป็น รูปจำลองทางกราฟฟิกที่ถูกสร้างขึ้นมาในชาร์ตจากราคา อ้างอิงตามหนึ่งในการวิเคราะห์ทางเทคนิค ที่ตั้งสมมติฐานมาว่า ประวัติศาสตร์ (การเคลื่อนไหวของราคา) มักจะเกิดขึ้นซ้ำรอยเดิม นั้นหมายความว่า การเคลื่อนไหวของราคาก็หมือนกับ สถานการณ์หนึ่งที่จะสามารถทำการคาดการณ์ไปยังทิศทางในอนาคต ตามเหตุการณ์ที่น่าจะมีความเป็นไปได้สูง
รูปแบบกราฟที่สำคัญจากทาง InstaTrade นั้นจะเป็นการบริการที่มีการใช้อย่างง่ายดาย ซึ่งจะช่วยให้คุณสามารถทราบถึงการเปลี่ยนแปลงล่าสุด ในตลาดได้ และสามารถรับมือกับข้อมูลจากทางตลาดได้ทันท่วงที ในการบริการของพวกเรานั้น คุณจะพบกับรูปแบบกราฟล่าสุดและมีความสำคัญมากที่สุดในทุกๆคู่สกุลเงิน และทุกๆขอบเขตเวลา
Bearish pennant
was formed on 24.03 at 18:29:43 (UTC+0)
signal strength 2 of 5
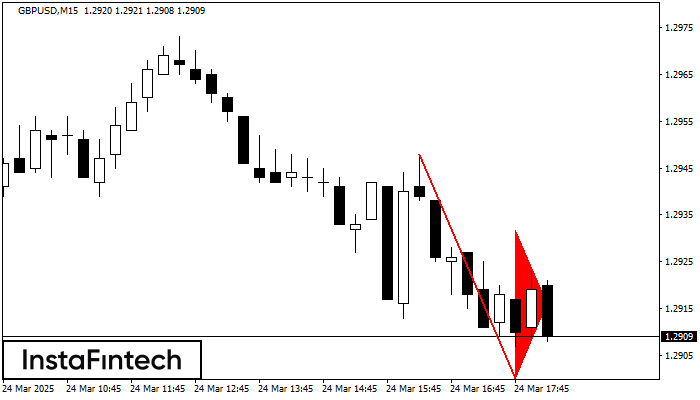
The Bearish pennant pattern has formed on the GBPUSD M15 chart. This pattern type is characterized by a slight slowdown after which the price will move in the direction of the original trend. In case the price fixes below the pattern’s low of 1.2900, a trader will be able to successfully enter the sell position.
The M5 and M15 time frames may have more false entry points.
ดูเพิ่มเติม
- All
- All
- Bearish Rectangle
- Bearish Symmetrical Triangle
- Bearish Symmetrical Triangle
- Bullish Rectangle
- Double Top
- Double Top
- Triple Bottom
- Triple Bottom
- Triple Top
- Triple Top
- All
- All
- Buy
- Sale
- All
- 1
- 2
- 3
- 4
- 5
รูปแบบกราฟหัวและหัวไหล่ (Head and Shoulders)
was formed on 09.06 at 15:40:28 (UTC+0)
signal strength 1 of 5
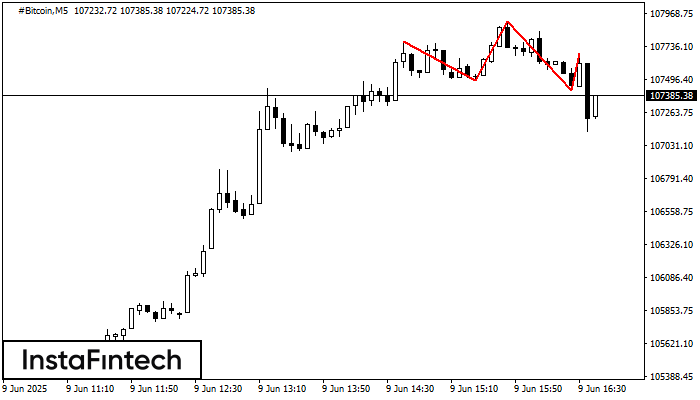
#Bitcoin M5 ได้สร้างรูปแบบ รูปแบบกราฟหัวและหัวไหล่ (Head and Shoulders) พร้อมกับคุณลักษณะดังต่อไปนี้ : ระดับสูงของตำแหน่งหัวอยู่ที่ 107912.77, ตำแหน่งคอ และมุมขาขึ้นอยู่ที่ 107491.49/107422.45 การก่อตัวของรูปแบบเช่นนี้
ขอบเตระยะเวลาใน M5 และ M15 อาจจะมีตำแหน่งการเข้าใช้งานที่ผิดพลาดมากยิ่งขึ้น
Open chart in a new window
รูปแบบกราฟหัวและหัวไหล่แบบกลับหัว (Inverse Head and Shoulder)
was formed on 09.06 at 15:30:31 (UTC+0)
signal strength 2 of 5

อ้างอิงจาก M15, #INTC กำลังก่อรูปแบบทางเทคนิคขึ้นมา รูปแบบกราฟหัวและหัวไหล่แบบกลับหัว (Inverse Head and Shoulder) ในกรณีที่มีการเคลื่อนตัวทะลุผ่านตำแหน่งคอ 20.54/20.43 ออกไป ตราสารก็อาจจะเคลื่อนตัวไปยัง 20.66
ขอบเตระยะเวลาใน M5 และ M15 อาจจะมีตำแหน่งการเข้าใช้งานที่ผิดพลาดมากยิ่งขึ้น
Open chart in a new window
รูปแบบกราฟธงขาขึ้น (Bullish Flag)
was formed on 09.06 at 15:30:14 (UTC+0)
signal strength 1 of 5

รูปแบบ รูปแบบกราฟธงขาขึ้น (Bullish Flag) ได้สร้างขึ้นมามาในชาร์ต #AMZN M5 ซึ่งแสดงให้เห็นว่า แนวโน้มขาขึ้นจะเกิดขึ้นต่อไป สัญญาณ: การเคลื่อนตัวทะลุผ่านระดับสูงสุดที่ 213.88 อาจจะผลักดันราคาให้สูงขึ้นกว่าเดิม และการปรับตัวขึ้นจะเป็นระยะทางไปยังตัวเสา
ขอบเตระยะเวลาใน M5 และ M15 อาจจะมีตำแหน่งการเข้าใช้งานที่ผิดพลาดมากยิ่งขึ้น
Open chart in a new window


