อ่านรายละเอียดเพิ่มเติม


 01.11.2023 06:45 AM
EUR/USD
Higher Timeframes
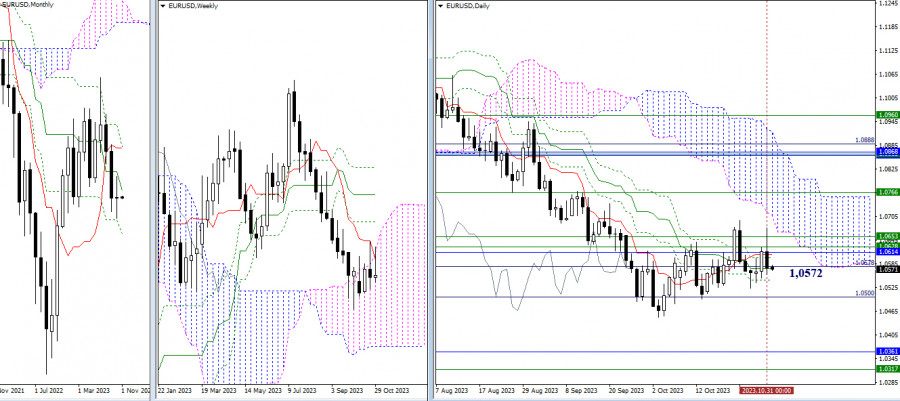
October closed with a candle of uncertainty. The market continues to operate within the range of daily levels, with the center of attraction being the medium-term trend (1.0572). At the start of the new trading month, minor adjustments to the Ichimoku indicator on the monthly timeframe led to the strengthening of the current weekly resistance zone (1.0628 - 1.0653) by the monthly medium-term trend (1.0614). As a result, the immediate objectives for bullish players, at the moment, are breaking through resistance levels (1.0614-28-53), updating the high (1.0695), and entering the daily cloud.
In the current situation, bearish players' prospects are focused on breaking through supports at 1.0500 - 1.0449 (the daily target level + the low) and declining towards the final level of the monthly Ichimoku cross (1.0360) and the lower boundary of the weekly cloud (1.0317).
H4 – H1
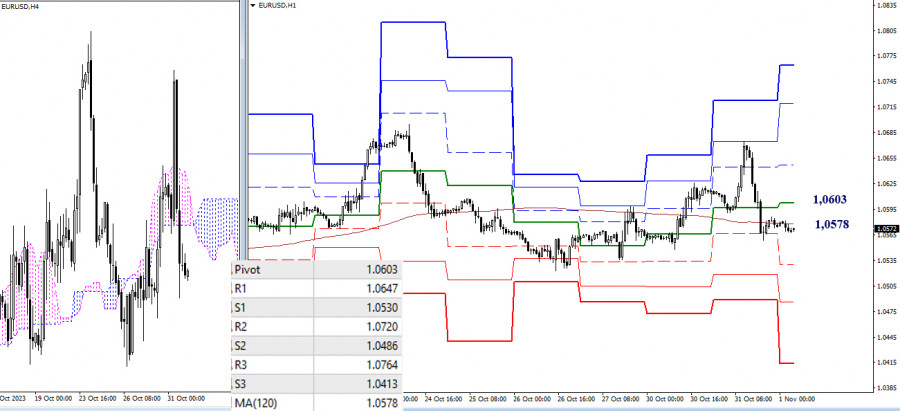
On the lower timeframes, there is also uncertainty in the past few hours. The market is hovering around the attraction zone of the weekly long-term trend (1.0578). The moving average is currently in a nearly horizontal position, confirming the balance of power. In the event of bearish activity and a strengthening of their sentiments, attention will be on passing through the supports of the classic pivot points (1.0530 - 1.0486 - 1.0413). If bulls restore their positions, their interests will shift towards breaking through the resistances of the classic pivot points (1.0603 - 1.0647 - 1.0720 - 1.0764).
***
GBP/USD
Higher Timeframes
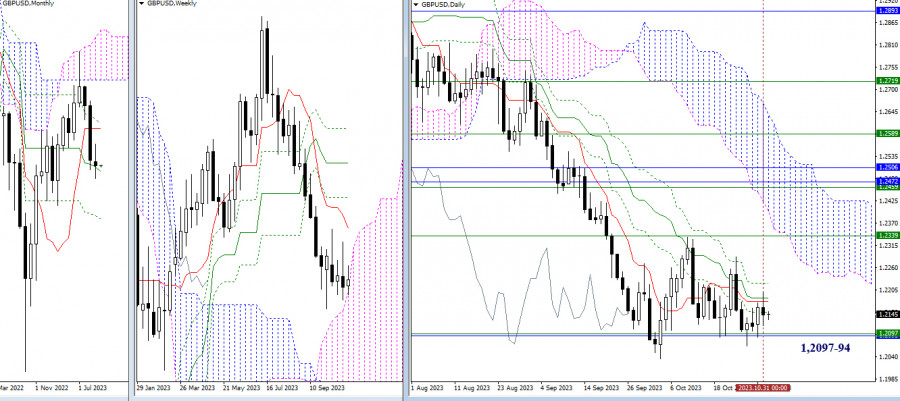
October did not provide clear support to any market players. The pair continues to consolidate around the upper boundary of the weekly cloud (1.2097). Most likely, the pound has decided to enter the weekly cloud in a sideways movement while utilizing the support of the monthly medium-term trend (1.2094). Only directed movement can change the situation. For bullish players, it is still important to overcome the attraction of the daily cross levels (1.2151 - 1.2178 - 1.2186 - 1.2221) and secure the support of the weekly short-term trend (1.2339). For bears, it is necessary to break free from the attraction of levels 1.2094 - 1.2097 and restore the downward trend (1.2036) to continue the decline.
H4 – H1
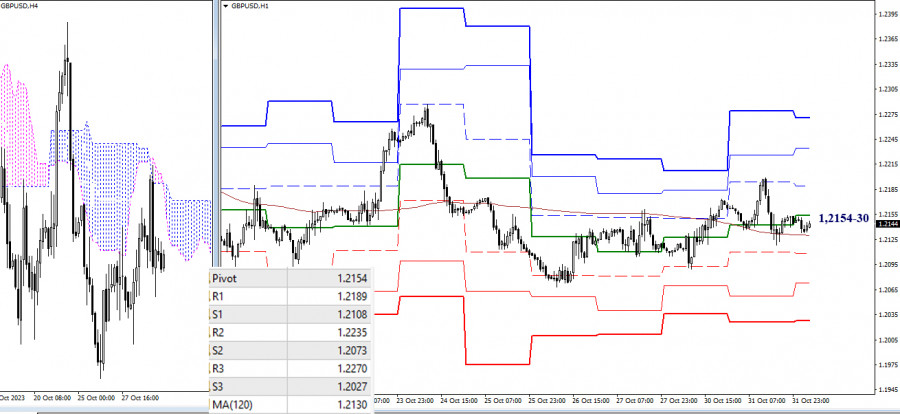
On the lower timeframes, the market is in a state of uncertainty and attraction to key levels, which are currently converging in the 1.2154-30 range (central pivot point + weekly long-term trend). Trading below these key levels will favor the development of bearish sentiments. Intraday bearish targets today are at 1.2108 - 1.2073 - 1.2027 (classic pivot points). Trading above these key levels will contribute to the strengthening of bullish positions. Intraday bullish targets can be noted at 1.2189 - 1.2235 - 1.2270 (resistances of the classic pivot points).
***
The technical analysis of the situation uses:
Higher timeframes - Ichimoku Kinko Hyo (9.26.52) + Fibo Kijun levels
Lower timeframes - H1 - Pivot Points (classic) + Moving Average 120 (weekly long-term trend)
You have already liked this post today
*บทวิเคราะห์ในตลาดที่มีการโพสต์ตรงนี้ เพียงเพื่อทำให้คุณทราบถึงข้อมูล ไม่ได้เป็นการเจาะจงถึงขั้นตอนให้คุณทำการซื้อขายตาม
ในช่วงต้นของการซื้อขายในอเมริกา คู่เงิน EUR/USD กำลังซื้อขายอยู่รอบ ๆ 1.1178 ต่ำกว่าเส้นค่าเฉลี่ย EMA 200 และต่ำกว่าเส้นค่าเฉลี่ย SMA 21 ภายใต้แรงกดดันด้านลบ เมื่อถึงบริเวณ 1.1270
ในช่วงต้นของช่วงการซื้อขายในสหรัฐฯ ทองคำกำลังซื้อขายอยู่ราวๆ 3,174.33 หลังจากได้พยายามแตะเพดานของช่องแนวโน้มขาลง เมื่อวานนี้ ทองคำร่วงลงไปต่ำสุดที่ 3,120 แต่ก็ฟื้นตัวกลับมาได้มากกว่า $130 ภายในไม่ถึง 24 ชั่วโมง ไปแตะที่ระดับ 3,251 มีการคาดการณ์ว่าทองคำจะยังคงฟื้นตัวขึ้นอีกในอีกไม่กี่ชั่วโมงข้างหน้านี้
ณ วันศุกร์ คู่สกุลเงิน USD/CAD ยังคงอยู่ภายใต้แรงกดดันติดต่อกันเป็นวันที่สองจากปัจจัยลบหลายอย่าง ข้อมูลเศรษฐกิจมหภาคของสหรัฐฯ ที่อ่อนแอกว่าที่คาดในเมื่อวานนี้ส่งเสริมการคาดการณ์ของตลาดว่าธนาคารกลางสหรัฐฯ อาจปรับลดอัตราดอกเบี้ยเพิ่มเติม ทำให้ผู้สนับสนุนดอลลาร์สหรัฐฯ ต้องป้องกันตัว นอกจากนี้ ราคาน้ำมันดิบยังคงคงที่ใกล้จุดสูงสุดในระยะหลัง ซึ่งช่วยสนับสนุนเงินดอลลาร์แคนาดาที่เชื่อมโยงกับสินค้าโภคภัณฑ์และเพิ่มแรงกดดันให้คู่ USD/CAD ลดลง
ลิงก์ที่เป็นประโยชน์: บทความอื่น ๆ ของฉันมีให้ในส่วนนี้ หลักสูตร InstaForex สำหรับผู้เริ่มต้น การวิเคราะห์ยอดนิยม เปิดบัญชีซื้อขาย สำคัญ: ผู้เริ่มต้นในการซื้อขาย Forex ควรระมัดระวังอย่างยิ่งเมื่อทำการตัดสินใจเข้าสู่ตลาด ก่อนการเผยแพร่รายงานสำคัญ ควรหลีกเลี่ยงการเข้าสู่ตลาดเพื่อป้องกันการเผชิญกับความผันผวนของตลาดที่เกิดจากการเปลี่ยนแปลงของราคาอย่างรุนแรง
ดัชนีดอลลาร์สหรัฐ ซึ่งติดตามประสิทธิภาพของดอลลาร์เทียบกับตะกร้าสกุลเงินหลัก ยังคงซื้อขายด้วยทิศทางขาลงเป็นวันที่สองติดต่อกัน ดัชนีความแข็งแกร่งสัมพัทธ์ (RSI) ในกราฟรายวันและกราฟ 4 ชั่วโมงได้เคลื่อนตัวไปยังเขตลบ และราคาก็ลดลงต่ำกว่าค่าเฉลี่ยเคลื่อนที่อย่างง่าย (SMA) 200 งวดในกราฟ 4 ชั่วโมง ซึ่งทำให้ดอลลาร์เสี่ยงต่อการตกลงต่อไปสู่ระดับสำคัญที่
เมื่อวันพฤหัสบดี คู่สกุลเงิน EUR/USD ได้ลดลงสองครั้งไปสู่ระดับ Fibonacci ที่ 127.2% ที่ 1.1181 และดีดกลับทั้งสองครั้ง ซึ่งส่งสัญญาณการกลับตัวที่เป็นผลดีต่อยูโร ซึ่งเปิดทางให้มีการเติบโตต่อเนื่องไปยังโซนแนวต้านที่ 1.1265–1.1282 ในวันนี้ การปิดต่ำกว่า
บนแผนภูมิต่อชั่วโมง, คู่สกุลเงิน GBP/USD ในวันพฤหัสบดีก่อนหน้านี้ได้เริ่มเคลื่อนไหวใหม่ ๆ เพื่อสนับสนุนพร้อมเงินชั่วคราว และเริ่มการเคลื่อนไหวอีกครั้งเพื่อสนับสนุนดอกไม้และเริ่มเคลื่อนไหวผ่านขวางโซนของ 1.3344–1.3357 การเด้งกลับจากโซนนี้จะเป็นการเคลื่อนไหวที่สนับสนุนดอกไม้และอาจนำไปสู่การลดลงอีกครั้งเมื่อมีการลงค่าโซนให้กับปริมาณการซื้อขายที่ 100.0% ที่ระดับ 1.3205 การทำลายผ่านของโซน 1.3344–1.3357 จะเพิ่มความน่าจะเป็นของการเติบโตต่อเนื่องไปยังระดับถัดไปที่
ในตลาดที่สงบเมื่อวานนี้ แม้ว่าจะมีการเผยแพร่ข้อมูลเศรษฐกิจหลากหลายจากยุโรปและสหรัฐอเมริกา แต่ยูโรยังคงสามารถปรับตัวขึ้นได้ 13 pip อย่างน้อยที่สุดสิ่งนี้ยืนยันเจตนาของสกุลเงินเดียวที่จะเคลื่อนตัวขึ้นต่อไป เป้าหมายแรกของการขึ้นนี้อยู่ที่ระดับ 1.1266 หลังจากนั้นจะเปิดเส้นทางไปสู่แนวต้านที่ 1.1420 ช่วงสามวันที่ผ่านมานี้ แท่งเทียนรายวันไม่ได้ลงไปต่ำกว่าระดับสมดุล แม้แต่เงาของแท่งเทียนก็ไม่ได้บ่งชี้ว่ามีการซื้อขายที่ยังคงแนวโน้มขาขึ้น อย่างไรก็ตาม ออสซิลเลเตอร์ของ
เมื่อวันพฤหัสบดีที่ผ่านมา สหราชอาณาจักรได้เผยแพร่ข้อมูล GDP ที่แข็งแกร่ง แต่กลับไม่ก่อให้เกิดการเคลื่อนไหวที่สังเกตเห็นได้ชัดในตลาดค่าเงิน เนื่องจากการเติบโตมาจากภาคบริการเพียงอย่างเดียว ในไตรมาสที่ 1 GDP เพิ่มขึ้น 0.7% และเพิ่มขึ้น 0.2% ในเดือนมีนาคม อย่างไรก็ตาม
วันศุกร์อาจเป็นวันสุดท้ายที่แท่งเทียนขาลง (สีดำ) ปรากฏเป็นวันที่สี่ติดต่อกัน ครั้งสุดท้ายที่รูปแบบนี้เกิดขึ้นคือในช่วงวันที่ 3–6 กุมภาพันธ์ ในกรณีนั้น และในการเกิดขึ้นสองครั้งก่อนหน้า มีการปรับฐานอย่างน้อย 1–2 วันตามมา ราคากำลังซื้อขายในช่วง 145.08/91 ซึ่งอยู่บนเส้น MACD
Your IP address shows that you are currently located in the USA. If you are a resident of the United States, you are prohibited from using the services of InstaFintech Group including online trading, online transfers, deposit/withdrawal of funds, etc.
If you think you are seeing this message by mistake and your location is not the US, kindly proceed to the website. Otherwise, you must leave the website in order to comply with government restrictions.
Why does your IP address show your location as the USA?
Please confirm whether you are a US resident or not by clicking the relevant button below. If you choose the wrong option, being a US resident, you will not be able to open an account with InstaTrade anyway.
We are sorry for any inconvenience caused by this message.


