อ่านรายละเอียดเพิ่มเติม


 16.06.2022 02:44 PM
The GBP/USD pair showed notable growth yesterday after the US Federal Reserve raised the rate by 75 instead of 50 basis points as was previously expected. Probably, the scenario of a rate hike of 75 basis points has already been priced in by the USD traders. How else can we explain such a sell-off in the US dollar? On the other hand, the same situation happened after the two previous rate hikes. The only difference was that traders were selling the greenback because the rate increase came in line with expectations. Yesterday, however, the Fed made a more aggressive move.
Yet, it seems that the pound bulls won't celebrate this victory for too long. Today, the Bank of England is due to announce its decision on the rate which is likely to be raised by only 25 basis points. However, if the UK regulator hikes the rate by 50 basis points instead of 25, this will definitely prompt the strengthening of the British currency. A lot will depend on the meeting minutes and the rhetoric of BoE's Governor Andrew Bailey. And now let's have a look at the GBP/USD chart.
Daily chart
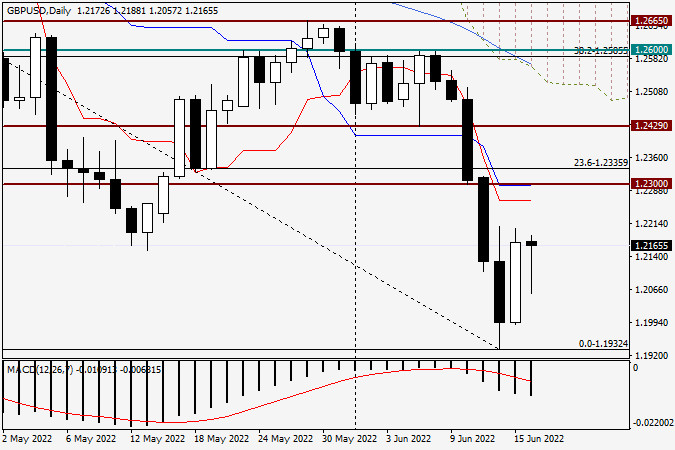
In yesterday's session, the pound/dollar pair notably advanced and closed the day at the level of 1.2172. Therefore, my assumptions about a corrective pullback towards 1.2200 and even 1.2300 made sense. At least, the price closely approached the level of 1.2200. Today, the pair has already pulled back to 1.2057, creating an opportunity to buy the pound. At the moment of writing, the pound/dollar pair is rapidly recovering from recent losses. Moreover, today's daily candlestick has formed a rather long lower shadow. However, when the BoE releases its decision on the rate, the technical picture for GBP/USD may change dramatically. You should keep this in mind and trade accordingly.
H4 chart
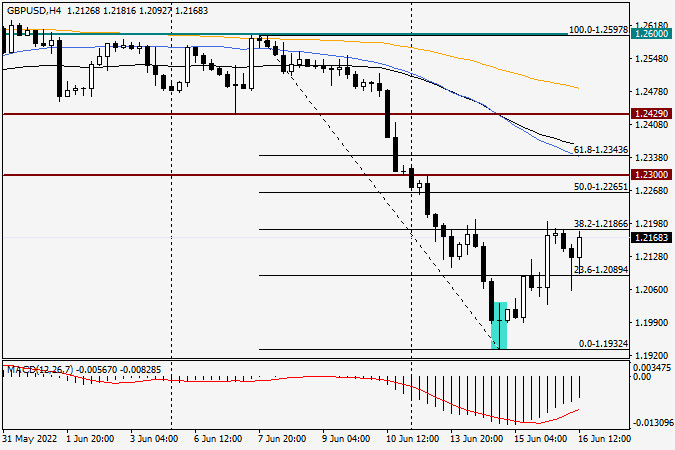
On the 4-hour chart, the reversal candlestick pattern called the Long-legged Doji that I mentioned yesterday has caused the required reaction in the market. In other words, traders took this signal into account, and the price began to rise. According to the Fibonacci grid stretched on a decline between 1.2597 and 1.1932, the pair managed to pull back to the 38.2 Fibonacci retracement. At this point, the price has faced strong resistance from sellers just below the level of 23.6. A very long shadow of the previous candlestick on the 4-hour chart and the current rise give hope that yesterday's uptrend can continue. It is quite obvious, though, that the trajectory of the pair today will mostly depend on the Bank of England's decision. That is why I wouldn't give any specific recommendations on trading the GBP/USD pair. One thing is for sure - today's volatility will be extremely high, so you should be very cautious.
Good luck!
You have already liked this post today
*บทวิเคราะห์ในตลาดที่มีการโพสต์ตรงนี้ เพียงเพื่อทำให้คุณทราบถึงข้อมูล ไม่ได้เป็นการเจาะจงถึงขั้นตอนให้คุณทำการซื้อขายตาม
สวัสดีครับ/ค่ะ เทรดเดอร์ทุกท่าน! เมื่อวันพุธที่ผ่านมา คู่เงิน EUR/USD ยังคงเคลื่อนไหวขึ้นต่อเนื่องหลังจากดีดตัวจากโซนสนับสนุนที่ 1.1374–1.1380 โดยสามารถปิดแนวเหนือระดับ Fibonacci retracement ที่ 76.4% ที่ 1.1454 ได้สำเร็จ
สวัสดีครับผู้ค้าทุกท่าน! จากแผนภูมิทุกชั่วโมงในวันพุธ, คู่ GBP/USD ได้เปลี่ยนสภาพง่ายๆ ให้โดยการขยายด้านที่ดีของบาทสหภาพประชาชาติและรวมกันที่ระดับการถอยหลังของฟิโบนัชชี 161.8% ที่ 1.3520. สิ่งนี้เปิดทางให้เกิดการเติบโตเพิ่มเติมสู่โซนการต้านทานที่ 1.3611–1.3620. การสะท้อนกลับไปในโซนนี้จะทำให้เกิดประโยชน์ให้กับดอลลาร์สหรัฐฯและนำไปสู่การถดถอยลงอย่างเล็กน้อยสู่ 1.3520. การรวมกันที่อยู่เหนือโซน 1.3611–1.3620
หากเรามองที่กราฟรายวันของเครื่องประเมินค่าสินค้า Crude Oil จะเห็นได้ว่ามีสภาวะ Divergence ระหว่างการเคลื่อนไหวของราคา #CL กับตัวบ่งชี้ Stochastic Oscillator ซึ่งบ่งชี้ว่ามีความเป็นไปได้ที่ #CL จะเผชิญกับการปรับฐานลงในอีกไม่กี่วันข้างหน้า แต่ตราบที่การปรับฐานไม่ทะลุและปิดต่ำกว่าระดับ 59.86
บนกราฟ 4 ชั่วโมงของดัชนี Nasdaq 100 มีการเบี่ยงเบนระหว่างการเคลื่อนไหวของราคากับตัวบ่งชี้ Stochastic Oscillator อย่างชัดเจน โดยเฉพาะอย่างยิ่งเมื่อนำมารวมกับการยืนยันการเคลื่อนไหวของราคา #NDX ที่กำลังเคลื่อนที่ต่ำกว่า EMA (21) ซึ่งเพิ่มความเป็นไปได้อย่างมากที่ดัชนีอาจอ่อนลงในอนาคตอันใกล้ถึงระดับ
กราฟรายวันแสดงให้เห็นว่า EUR/USD มีการซื้อขายภายในช่องทางขาขึ้นตั้งแต่เดือนกุมภาพันธ์ และมีแนวโน้มที่จะเพิ่มขึ้นต่อเนื่องเพื่อไปถึงระดับสูงสุดในเดือนเมษายนที่ประมาณ 1.1571 ทั้งยังอาจจะสูงถึงระดับ 8/8 Murray ที่ 1.1714 อีกด้วย ดังนั้น การเข้าซื้อคู่เงิน EUR/USD ขณะที่ราคายังคงปรับตัวเหนือค่าเฉลี่ยเคลื่อนที่
แนวโน้มของ XAU/USD ยังคงเป็นขาขึ้นตราบใดที่ราคาคงที่เหนือ 3,331 ดังนั้น จึงควรซื้อทองคำตราบใดที่ราคาคงที่เหนือ 3,359 ซึ่งเป็นตำแหน่งของระดับ 7/8 ของ Murray ความผันผวนของทองคำจะยังคงมีต่อไปในไม่กี่วันข้างหน้า โดยเราคาดว่าราคาจะเคลื่อนไหวระหว่าง 3,386
ข้อมูลเงินเฟ้อของสหรัฐที่เปิดเผยในวันพุธทำให้ตลาดเกิดความเคลื่อนไหว: ดัชนีดอลลาร์ลดลง 0.47%, น้ำมัน WTI พุ่งขึ้น 5.54%, ราคาทองคำเพิ่มขึ้น 1.27%, และอัตราผลตอบแทนพันธบัตรรัฐบาลสหรัฐอายุ 5 ปีลดลงจาก 4.08% เป็น 4.01%
เมื่อวันพุธที่ผ่านมา เงินปอนด์อังกฤษสามารถหลีกเลี่ยงการลงต่ำกว่าระดับแนวรับทางเทคนิคได้อย่างสำเร็จ โดยได้กลับทิศทางขึ้นจากระดับดังกล่าว ราคาฟื้นตัวจากเส้นดัชนี MACD ในกราฟรายวัน ขณะเดียวกัน ตัวบ่งชี้ Marlin ก็ปรับทิศทางขึ้นจากขอบเขตล่างของช่องขาขึ้นของมัน ราคากำลังเคลื่อนไหวไปยังเป้าหมายแรกที่ 1.3635 และเมื่อลงไปถึงต่ำกว่าจุดนี้ จะเคลื่อนไปยังเส้นด้านในของช่องราคาใกล้ 1.3714
การปรับราคาตั้งแต่วันที่ 27 พฤษภาคมซับซ้อนและยืดเยื้อ ทำให้มีความเสี่ยงที่จะเกิดการทะลุขึ้นเหนือระดับ 146.11 อย่างไรก็ตาม ความเสี่ยงนี้ไม่เป็นกังวลอีกต่อไปหลังจากการกลับทิศทางที่ 145.08 การร่วงลงต่ำกว่าเส้นสมดุล (เส้นค่าเฉลี่ยเคลื่อนที่สีแดง) และตัวบ่งชี้ Marlin ที่เข้าสู่ดินแดนลบ เป้าหมายขาลงอยู่ที่ 141.70
วันนี้ ตลาดจะมีจุดสนใจหลักอยู่ที่การเผยแพร่รายงานเงินเฟ้อของสหรัฐฯ ซึ่งคาดว่าจะไม่ได้แสดงถึงการหยุดการลดลงในช่วงที่ผ่านมา แต่จะแสดงถึงการเพิ่มขึ้นของอัตราเงินเฟ้อที่สูงที่สุดในรอบสี่เดือนที่ผ่านมา ตามการคาดการณ์ทั่วไป อัตราเงินเฟ้อผู้บริโภคทั่วไปในปีนี้คาดว่าจะเพิ่มขึ้นจาก 2.3% เป็น 2.5% ขณะที่อัตราเงินเฟ้อพื้นฐานคาดว่าจะเพิ่มขึ้นจาก 2.8% เป็น 2.9% นี่เป็นสัญญาณเชิงลบสำหรับโทเคน แต่เป็นสัญญาณเชิงบวกสำหรับดอลลาร์สหรัฐฯ
Your IP address shows that you are currently located in the USA. If you are a resident of the United States, you are prohibited from using the services of InstaFintech Group including online trading, online transfers, deposit/withdrawal of funds, etc.
If you think you are seeing this message by mistake and your location is not the US, kindly proceed to the website. Otherwise, you must leave the website in order to comply with government restrictions.
Why does your IP address show your location as the USA?
Please confirm whether you are a US resident or not by clicking the relevant button below. If you choose the wrong option, being a US resident, you will not be able to open an account with InstaTrade anyway.
We are sorry for any inconvenience caused by this message.


