อ่านรายละเอียดเพิ่มเติม


 10.06.2022 11:14 AM
Hi everyone!
Traditionally, I make an analysis of the euro/pound par on Friday. In today's two previous articles on the euro/dollar and pound/dollar pairs, I analyzed the results of yesterday's ECB meeting, the market reaction, and the main risks for the UK economy. For this reason, in this article, I will focus mainly on the technical analysis of EUR/GBP. Let's look at the weekly chart.
Weekly
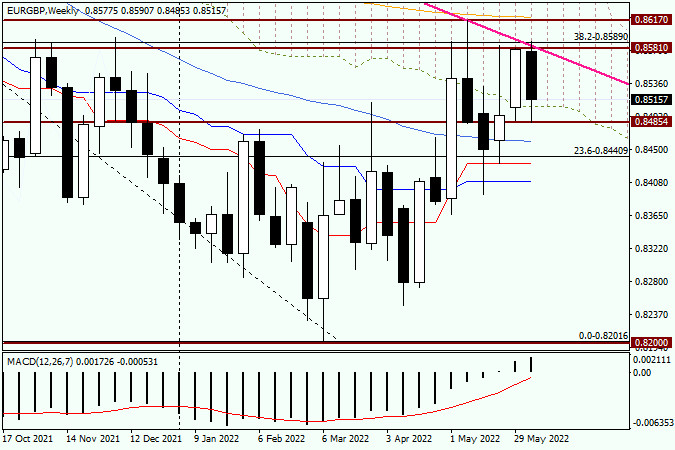
Despite the fact that the euro/pound finished last week near the Ichimoku Cloud, the bears were not ready to give up. As seen on the chart, the pair has been trading in a bearish channel during this week. Sellers have even tried to push the price below the Ichimoku Cloud. Thus, they will do everything possible to end the week near the cloud. Some sellers will try to complete the week near the indicator, while others, on the contrary, will try to push the price down. Judging by technical indicators, there is a strong resistance area of 0.8581-0.8617. At the first level, the highest level of last week was located. The bulls' attempts to break through the resistance level of 0.8581 only led to a false breakout.
The support level indicates last week's lows as trading was carried out at 0.8487. The attempts of bears to push the pair below this level were also unsuccessful. Given the technical outlook on the weekly chart, the bullish trend is possible only after a breakout of the resistance level of 0.8617 and the 200 exponential moving average, which is located at this level. Bears have a more difficult task. They need to push the price to all previously passed indicators: 50 moving average, the Tenkan, and Kijun lines. Currently, the pair is n the correction phase. After a decline to 0.9216-0.8201, the pair retreated to the Fibonacci level of 38.2 which shows a bearish trend. Thus, the EUR/GBP pair is in a downtrend channel. It is also confirmed by the pink resistance line. Attempts to break through this line were also unsuccessful.
Daily
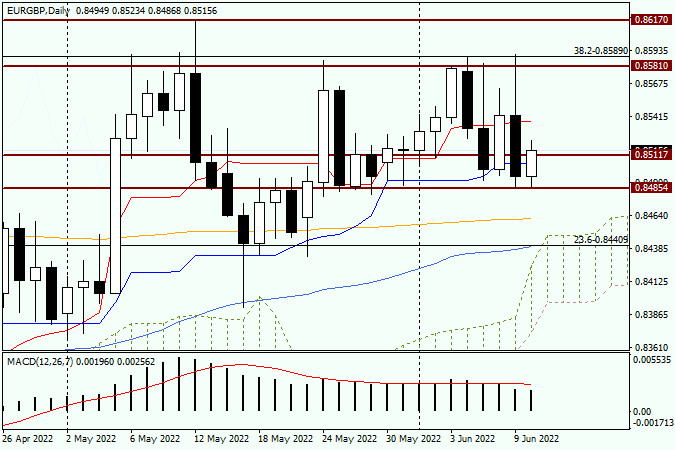
Yesterday's daily candlestick is very similar to the one that was formed for the EUR/GBP pair. After a rise to 0.8590, there was a sharp downward reversal to 0.8485. Apparently, this is a strong technical level as it has stopped yesterday's fall but also facilitated today's growth. If the euro/pound pair continues to rise, it will face resistance near the Tenkan red line, which runs at 0.8538. The pair is trading near 0.8517. Bulls and bears are likely to tussle for the closing price of the day and week near the psychologically important level of 0.8500. Given trader's disappointment with the ECB's rhetoric, as well as yesterday's bearish candlestick with a long upper shadow, the likelihood of a decline is high. It is better to wait for the convergence with the Tenkan line. After that, I would advise you to monitor bearish candlestick patterns on the weekly or smaller charts. If they appear, it will be a sell signal.
Have a wonderful weekend!
You have already liked this post today
*บทวิเคราะห์ในตลาดที่มีการโพสต์ตรงนี้ เพียงเพื่อทำให้คุณทราบถึงข้อมูล ไม่ได้เป็นการเจาะจงถึงขั้นตอนให้คุณทำการซื้อขายตาม
ลิงก์ที่มีประโยชน์: บทความอื่นๆ ของฉันสามารถอ่านได้ในส่วนนี้ คอร์ส InstaForex สำหรับผู้เริ่มต้น การวิเคราะห์ยอดนิยม เปิดบัญชีซื้อขาย คำสำคัญ: ผู้เริ่มต้นในตลาด forex จำเป็นต้องระมัดระวังอย่างมากในการตัดสินใจเข้าสู่ตลาด ก่อนการประกาศรายงานสำคัญ แนะนำให้อยู่ห่างจากตลาดเพื่อหลีกเลี่ยงการติดอยู่ในภาวะตลาดที่ผันผวนสูงซึ่งเกิดจากความผันผวนที่เพิ่มขึ้น หากคุณตัดสินใจซื้อขายในช่วงการประกาศข่าว
ในวันอังคาร, คู่ EUR/USD กลับเป็นในภาคผู้สนับสนุนของยูโรและพุ่งขึ้นไปยังโซนต้านทานที่ 1.1374–1.1383 การเด้งกลับจากโซนนี้ทำให้เกิดการลดลงในภาคผู้สนับสนุนของดอลลาร์สหรัฐฯ, โดยที่คู่นั้นกลับไปตกที่ระดับของการชะลอในรภาพของ Fibonacci ที่ 100.0% ที่ 1.1265 นี่คือวันที่หกที่มีการซื้อขายระดับต่อเนื่องระหว่าง 1.1265
บนแผนภูมิชั่วโมง, คู่ GBP/USD ในวันอังคารผันตัวเป็นฝ่ายของปอนด์สหราชอาณาจักรและปิดสูงกว่าโซนความต้านทานที่ 1.3344–1.3357 ดังนั้น, การเด้งที่สมบูรณ์จากโซนนี้วันนี้อาจนำไปสู่การเคลื่อนไหวขึ้นยังต่ออาจนำไปสู่การเคลื่อนไหวขึ้นยังต่อไปที่ระดับ 1.3425 อย่างไรก็ตาม, การที่มีการรวมกันอยู่ใต้โซนนี้จะสนับสนุนดอลลาร์สหราชอาณาจักรและดำเนินการลดลงต่อไปยังระดับ 100.0% ของ Fibonacci ที่ 1.3205
หากเราดูที่กราฟ 4 ชั่วโมงของคู่ค่าเงิน AUD/JPY จะเห็นรูปแบบ Descending Broadening Wedge ซึ่งรูปแบบนี้ให้สัญญาณว่าในอนาคตอันใกล้ AUD/JPY มีแนวโน้มที่จะแข็งค่าขึ้นในทิศทางเหนือไปทดสอบระดับ 93.52 ในอนาคตอันใกล้นี้ หากระดับนี้ถูกทะลุและปิดเหนือระดับดังกล่าวได้ AUD/JPY
กราฟรายวันแสดงให้เห็นว่า EUR/USD กำลังซื้อขายต่ำกว่าช่องเทรนด์ขาลงที่เกิดขึ้นเมื่อวันที่ 17 เมษายนภายใต้แรงกดดันขาลง ยูโรอยู่ต่ำกว่า 1/8 Murray และต่ำกว่า 21 SMA ในทางเทคนิค ยูโรอ่อนล้า ดังนั้นมุมมองขาลงอาจยังคงมีผลต่อไปตราบที่ ER/USD
ในช่วงเช้าของตลาดอเมริกา ทองคำซื้อขายอยู่ที่ประมาณ 3,381 หลังจากร่วงลงจากจุดสูงสุดที่ประมาณ 3,397 ทองคำในฐานะสินทรัพย์ปลอดภัยมีความวิตกเนื่องจากความตึงเครียดทางภูมิรัฐศาสตร์ที่เกิดขึ้นทั่วโลก ในทางเทคนิค ทองคำกำลังแสดงให้เห็นถึงแนวโน้มขาขึ้น ซึ่งอาจขึ้นไปสู่ระดับจิตวิทยาที่ $3,500 ในอีกไม่กี่วันข้างหน้าและอาจจะถึง +1/8 Murray ที่ตั้งอยู่ที่ 3,515
ลิงก์ที่เป็นประโยชน์: บทความอื่นๆ ของฉันมีอยู่ในส่วนนี้ หลักสูตรสำหรับผู้เริ่มต้นของ InstaForex การวิเคราะห์ยอดนิยม เปิดบัญชีซื้อขาย ข้อควรระวัง: ผู้เริ่มต้นในการซื้อขายฟอเร็กซ์ควรระมัดระวังเป็นพิเศษเมื่อทำการตัดสินใจเกี่ยวกับการเข้าสู่ตลาด ก่อนการเปิดเผยรายงานสำคัญ การหลีกเลี่ยงการเข้าตลาดจะดีที่สุดเพื่อหลีกเลี่ยงการเผชิญความผันผวนที่รุนแรงเนื่องจากความผันแปรที่เพิ่มขึ้น หากคุณตัดสินใจที่จะทำการค้าในระหว่างการเปิดเผยข่าว ควรวางคำสั่งหยุดการขาดทุนเสมอเพื่อจำกัดการสูญเสีย หากไม่ได้วางคำสั่งหยุดการขาดทุน คุณอาจสูญเสียเงินฝากทั้งก้อนอย่างรวดเร็ว
ในวันจันทร์ คู่สกุลเงิน EUR/USD ได้เกิดการกลับตัวใหม่ในทิศทางที่เป็นผลดีแก่ดอลลาร์สหรัฐ แต่ครั้งนี้การขยับตัวลงยิ่งอ่อนแรงลง ในช่วงเวลาส่วนใหญ่ของสัปดาห์ที่ผ่านมา กลุ่มผู้ขายได้ทำการโจมตีที่ไม่ค่อยมีแรงสนับสนุน เนื่องจากถูกสวนกลับด้วยบรรยากาศข้อมูลเชิงลบจากสหรัฐอเมริกา รายงานส่วนใหญ่แสดงถึงสภาพเศรษฐกิจอเมริกาที่แย่ลง ทำให้ดอลลาร์สหรัฐแสดงการเติบโตได้ยากมาก ฉันไม่คาดว่าจะเห็นการลดลงต่ำกว่าระดับการแก้ไข 100.0% ที่ 1.1265 ในอนาคตอันใกล้นี้
ในกราฟรายชั่วโมง คู่เงิน GBP/USD ยังคงเคลื่อนไหวในทิศทางด้านข้างในวันจันทร์ การเคลื่อนไหวในทิศทางด้านข้างนี้เริ่มขึ้นตั้งแต่สัปดาห์ที่แล้วเมื่อมีการเผยแพร่ชุดรายงานสำคัญในสหรัฐฯ และนักลงทุนคาดหวังว่าจะมีการซื้อขายที่เข้มข้นมากขึ้น อย่างไรก็ตาม รายงานส่วนใหญ่ถูกมองว่าไม่มีนัยสำคัญภายใต้สถานการณ์ปัจจุบัน และเทรดเดอร์ยังคงจับตาดูการแถลงข่าวของโดนัลด์ ทรัมป์อย่างใกล้ชิด โดยคาดหวังว่าจะมีการลดความตึงเครียดในความขัดแย้งระหว่างสหรัฐฯ และจีน ในช่วงที่ขาดข่าวสาร เทรดเดอร์มักไม่กระทำการใด
วิดีโอแนะนำการฝึก

Your IP address shows that you are currently located in the USA. If you are a resident of the United States, you are prohibited from using the services of InstaFintech Group including online trading, online transfers, deposit/withdrawal of funds, etc.
If you think you are seeing this message by mistake and your location is not the US, kindly proceed to the website. Otherwise, you must leave the website in order to comply with government restrictions.
Why does your IP address show your location as the USA?
Please confirm whether you are a US resident or not by clicking the relevant button below. If you choose the wrong option, being a US resident, you will not be able to open an account with InstaTrade anyway.
We are sorry for any inconvenience caused by this message.


