อ่านรายละเอียดเพิ่มเติม


 27.05.2022 10:49 AM
As predicted in my previous review on EUR/USD, the most popular currency pair on Forex developed an upward movement yesterday. This means that market participants have quickly digested the FOMC minutes and resumed the bullish scenario. The fundamental factors also supported the euro bulls. Yesterday, the revised data on US GDP for the first quarter turned out to be below the estimate of -1.3% and actually stood at -1.5%. Against this backdrop, many investors feared that the US Federal Reserve may revise its aggressive approach towards monetary policy and start to ease it.
It is well known that the best way to tackle high inflation is to raise interest rates. However, this method works only when the economy is strong and everything goes according to the Fed's plan. Yesterday's data on GDP in the US showed once again that the world's leading economy is not doing well. Besides, the next two rate hikes of 50 basis points have most likely been priced in by the USD market players. Before moving on to the technical review, let me remind you that today we expect a block of macroeconomic data from the US later in the afternoon. This will include the data on personal income and spending as well as the core personal consumption expenditures price index.
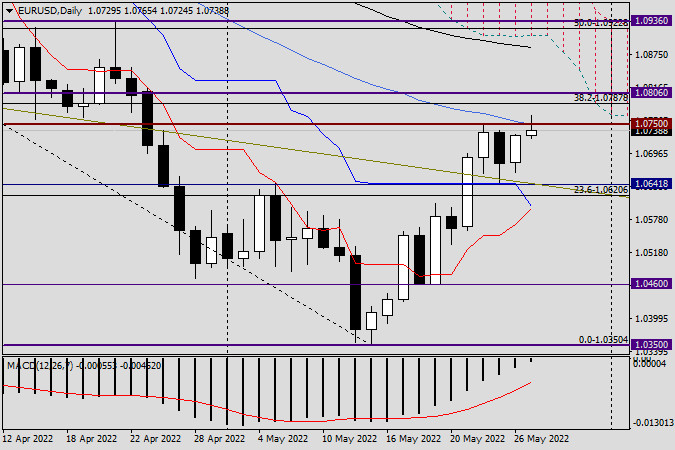
Daily chart
The bullish candlestick from yesterday with a closing price of 1.0729 was a natural transition from the previous black candlestick with a long lower shadow. On May 25, EUR/USD made an accurate pullback to the broken resistance of 1.0641 and then, following the rules of technical analysis, reversed to the upside. At the moment of writing, the euro bulls have already made an attempt to break above the 50-day simple moving average and the strong resistance level of 1.0750. These attempts have failed so far as the price made a downside pullback from this level and the 50-day MA, even though this movement was very weak. If the pair closes the day above 1.0750, this will certainly confirm the bullish scenario, and a close of the weekly session above 1.0767 will further strengthen it. I will talk about this in more detail on Monday. In case a bearish candlestick pattern appears on the daily chart by the end of the day, the quote may struggle to overcome the 50-day MA and the levels of 1 1.0750 and 1.0767 or may even stop doing this.
Trading recommendations. I usually do not recommend opening new positions on Friday so that they are rolled over to Monday. Despite the fact that the bullish scenario is very likely, it is not a good idea to open buy trades under strong resistance levels such as the 50-day MA and the levels of 1.0750 and1.0767. I advise you to stay out of the market today as this is also an option. We will provide a more detailed technical analysis of EUR/USD on Monday based on the result of the weekly session.
Have a good day!
You have already liked this post today
*บทวิเคราะห์ในตลาดที่มีการโพสต์ตรงนี้ เพียงเพื่อทำให้คุณทราบถึงข้อมูล ไม่ได้เป็นการเจาะจงถึงขั้นตอนให้คุณทำการซื้อขายตาม
ในช่วงต้นของการซื้อขายในอเมริกา คู่เงิน EUR/USD กำลังซื้อขายอยู่รอบ ๆ 1.1178 ต่ำกว่าเส้นค่าเฉลี่ย EMA 200 และต่ำกว่าเส้นค่าเฉลี่ย SMA 21 ภายใต้แรงกดดันด้านลบ เมื่อถึงบริเวณ 1.1270
ในช่วงต้นของช่วงการซื้อขายในสหรัฐฯ ทองคำกำลังซื้อขายอยู่ราวๆ 3,174.33 หลังจากได้พยายามแตะเพดานของช่องแนวโน้มขาลง เมื่อวานนี้ ทองคำร่วงลงไปต่ำสุดที่ 3,120 แต่ก็ฟื้นตัวกลับมาได้มากกว่า $130 ภายในไม่ถึง 24 ชั่วโมง ไปแตะที่ระดับ 3,251 มีการคาดการณ์ว่าทองคำจะยังคงฟื้นตัวขึ้นอีกในอีกไม่กี่ชั่วโมงข้างหน้านี้
ณ วันศุกร์ คู่สกุลเงิน USD/CAD ยังคงอยู่ภายใต้แรงกดดันติดต่อกันเป็นวันที่สองจากปัจจัยลบหลายอย่าง ข้อมูลเศรษฐกิจมหภาคของสหรัฐฯ ที่อ่อนแอกว่าที่คาดในเมื่อวานนี้ส่งเสริมการคาดการณ์ของตลาดว่าธนาคารกลางสหรัฐฯ อาจปรับลดอัตราดอกเบี้ยเพิ่มเติม ทำให้ผู้สนับสนุนดอลลาร์สหรัฐฯ ต้องป้องกันตัว นอกจากนี้ ราคาน้ำมันดิบยังคงคงที่ใกล้จุดสูงสุดในระยะหลัง ซึ่งช่วยสนับสนุนเงินดอลลาร์แคนาดาที่เชื่อมโยงกับสินค้าโภคภัณฑ์และเพิ่มแรงกดดันให้คู่ USD/CAD ลดลง
ลิงก์ที่เป็นประโยชน์: บทความอื่น ๆ ของฉันมีให้ในส่วนนี้ หลักสูตร InstaForex สำหรับผู้เริ่มต้น การวิเคราะห์ยอดนิยม เปิดบัญชีซื้อขาย สำคัญ: ผู้เริ่มต้นในการซื้อขาย Forex ควรระมัดระวังอย่างยิ่งเมื่อทำการตัดสินใจเข้าสู่ตลาด ก่อนการเผยแพร่รายงานสำคัญ ควรหลีกเลี่ยงการเข้าสู่ตลาดเพื่อป้องกันการเผชิญกับความผันผวนของตลาดที่เกิดจากการเปลี่ยนแปลงของราคาอย่างรุนแรง
ดัชนีดอลลาร์สหรัฐ ซึ่งติดตามประสิทธิภาพของดอลลาร์เทียบกับตะกร้าสกุลเงินหลัก ยังคงซื้อขายด้วยทิศทางขาลงเป็นวันที่สองติดต่อกัน ดัชนีความแข็งแกร่งสัมพัทธ์ (RSI) ในกราฟรายวันและกราฟ 4 ชั่วโมงได้เคลื่อนตัวไปยังเขตลบ และราคาก็ลดลงต่ำกว่าค่าเฉลี่ยเคลื่อนที่อย่างง่าย (SMA) 200 งวดในกราฟ 4 ชั่วโมง ซึ่งทำให้ดอลลาร์เสี่ยงต่อการตกลงต่อไปสู่ระดับสำคัญที่
เมื่อวันพฤหัสบดี คู่สกุลเงิน EUR/USD ได้ลดลงสองครั้งไปสู่ระดับ Fibonacci ที่ 127.2% ที่ 1.1181 และดีดกลับทั้งสองครั้ง ซึ่งส่งสัญญาณการกลับตัวที่เป็นผลดีต่อยูโร ซึ่งเปิดทางให้มีการเติบโตต่อเนื่องไปยังโซนแนวต้านที่ 1.1265–1.1282 ในวันนี้ การปิดต่ำกว่า
บนแผนภูมิต่อชั่วโมง, คู่สกุลเงิน GBP/USD ในวันพฤหัสบดีก่อนหน้านี้ได้เริ่มเคลื่อนไหวใหม่ ๆ เพื่อสนับสนุนพร้อมเงินชั่วคราว และเริ่มการเคลื่อนไหวอีกครั้งเพื่อสนับสนุนดอกไม้และเริ่มเคลื่อนไหวผ่านขวางโซนของ 1.3344–1.3357 การเด้งกลับจากโซนนี้จะเป็นการเคลื่อนไหวที่สนับสนุนดอกไม้และอาจนำไปสู่การลดลงอีกครั้งเมื่อมีการลงค่าโซนให้กับปริมาณการซื้อขายที่ 100.0% ที่ระดับ 1.3205 การทำลายผ่านของโซน 1.3344–1.3357 จะเพิ่มความน่าจะเป็นของการเติบโตต่อเนื่องไปยังระดับถัดไปที่
ในตลาดที่สงบเมื่อวานนี้ แม้ว่าจะมีการเผยแพร่ข้อมูลเศรษฐกิจหลากหลายจากยุโรปและสหรัฐอเมริกา แต่ยูโรยังคงสามารถปรับตัวขึ้นได้ 13 pip อย่างน้อยที่สุดสิ่งนี้ยืนยันเจตนาของสกุลเงินเดียวที่จะเคลื่อนตัวขึ้นต่อไป เป้าหมายแรกของการขึ้นนี้อยู่ที่ระดับ 1.1266 หลังจากนั้นจะเปิดเส้นทางไปสู่แนวต้านที่ 1.1420 ช่วงสามวันที่ผ่านมานี้ แท่งเทียนรายวันไม่ได้ลงไปต่ำกว่าระดับสมดุล แม้แต่เงาของแท่งเทียนก็ไม่ได้บ่งชี้ว่ามีการซื้อขายที่ยังคงแนวโน้มขาขึ้น อย่างไรก็ตาม ออสซิลเลเตอร์ของ
เมื่อวันพฤหัสบดีที่ผ่านมา สหราชอาณาจักรได้เผยแพร่ข้อมูล GDP ที่แข็งแกร่ง แต่กลับไม่ก่อให้เกิดการเคลื่อนไหวที่สังเกตเห็นได้ชัดในตลาดค่าเงิน เนื่องจากการเติบโตมาจากภาคบริการเพียงอย่างเดียว ในไตรมาสที่ 1 GDP เพิ่มขึ้น 0.7% และเพิ่มขึ้น 0.2% ในเดือนมีนาคม อย่างไรก็ตาม
วันศุกร์อาจเป็นวันสุดท้ายที่แท่งเทียนขาลง (สีดำ) ปรากฏเป็นวันที่สี่ติดต่อกัน ครั้งสุดท้ายที่รูปแบบนี้เกิดขึ้นคือในช่วงวันที่ 3–6 กุมภาพันธ์ ในกรณีนั้น และในการเกิดขึ้นสองครั้งก่อนหน้า มีการปรับฐานอย่างน้อย 1–2 วันตามมา ราคากำลังซื้อขายในช่วง 145.08/91 ซึ่งอยู่บนเส้น MACD
Your IP address shows that you are currently located in the USA. If you are a resident of the United States, you are prohibited from using the services of InstaFintech Group including online trading, online transfers, deposit/withdrawal of funds, etc.
If you think you are seeing this message by mistake and your location is not the US, kindly proceed to the website. Otherwise, you must leave the website in order to comply with government restrictions.
Why does your IP address show your location as the USA?
Please confirm whether you are a US resident or not by clicking the relevant button below. If you choose the wrong option, being a US resident, you will not be able to open an account with InstaTrade anyway.
We are sorry for any inconvenience caused by this message.

