อ่านรายละเอียดเพิ่มเติม


 25.10.2021 01:00 PM
EUR/USD
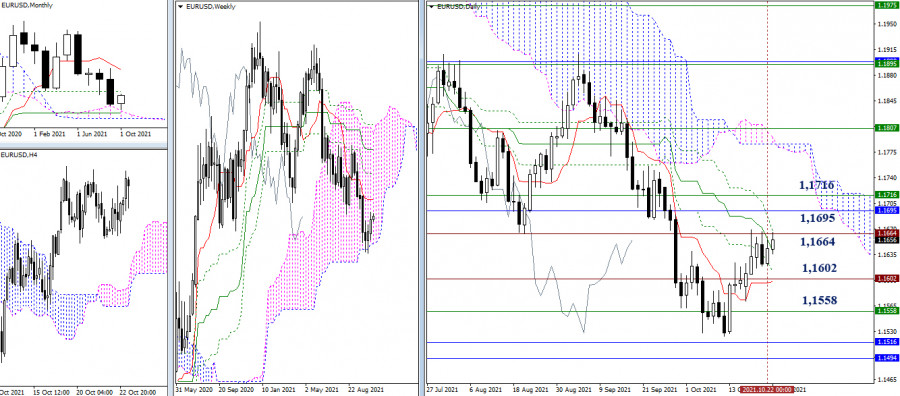
The slowdown below the historical resistance of 1.1664 remains. The final level of the Ichimoku daily dead cross (1.1667) has fallen into this area today. As a result, the breakdown of resistance will eliminate the bearish cross and help the bulls to strengthen their positions. The next upward targets are still at 1.1695 (monthly Fibo Kijun) and 1.1716 (weekly Tenkan). But in the case of bearish activity, the nearest support level of 1.1602 (historical level + daily levels) will be considered. The next interests can be directed to interacting with the level of 1.1558 (lower border of the weekly cloud) and 1.1516 - 1.1494 (monthly levels).
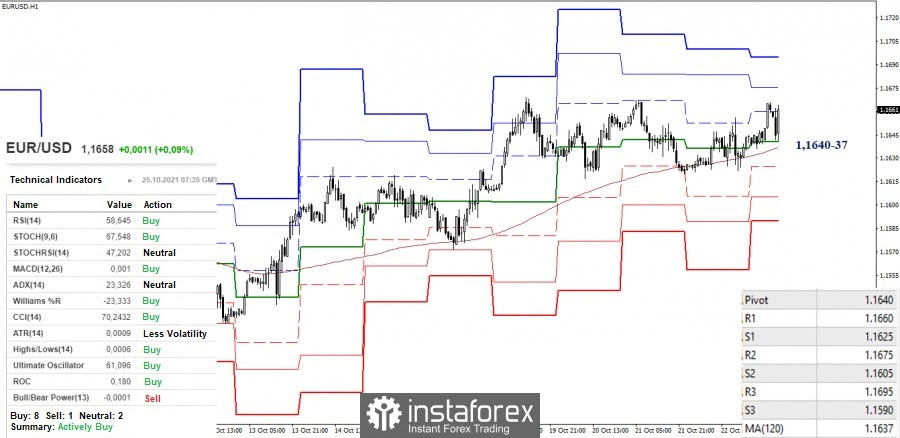
The pair continues to remain in the zone of the downward correction in the smaller timeframes. For a long time, the key support levels are being tested. They are joining forces in the area of 1.1640-37 today. A breakdown, consolidation below, and a reversal of moving averages will change the current balance of power in favor of the bears. The support for the classic pivot levels 1.1625 - 1.1605 - 1.1590 will serve as the intraday downward pivot points.
As for the bulls, the main task is to restore the upward trend (1.1669). The next upward pivot points can be 1.1675 (R2) and 1.1695 (R3), these resistances are being strengthened from the higher timeframes.
GBP/USD
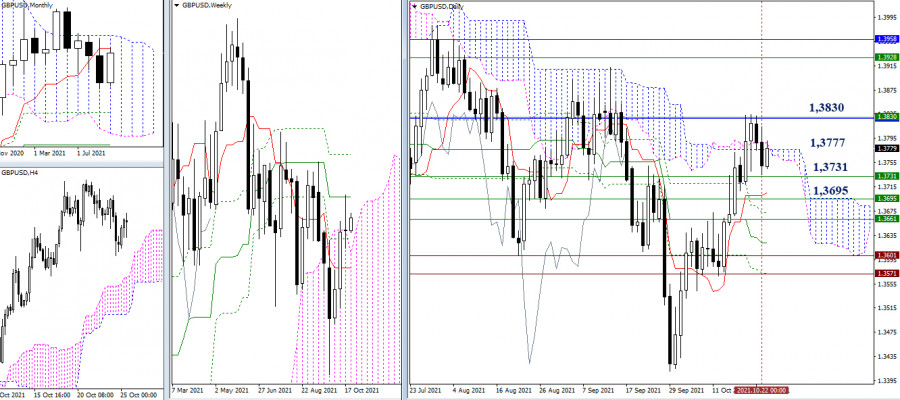
The bulls could not hold their positions below the encountered resistance level of 1.3830 (monthly short-term trend + weekly medium-term trend) during last week's closing. Currently, the attraction zone continues to provide a daily cloud (1.3777). The nearest support levels are set sequentially with some distance from each other – 1.3731 - 1.3695 - 1.3661 (daily and weekly levels).
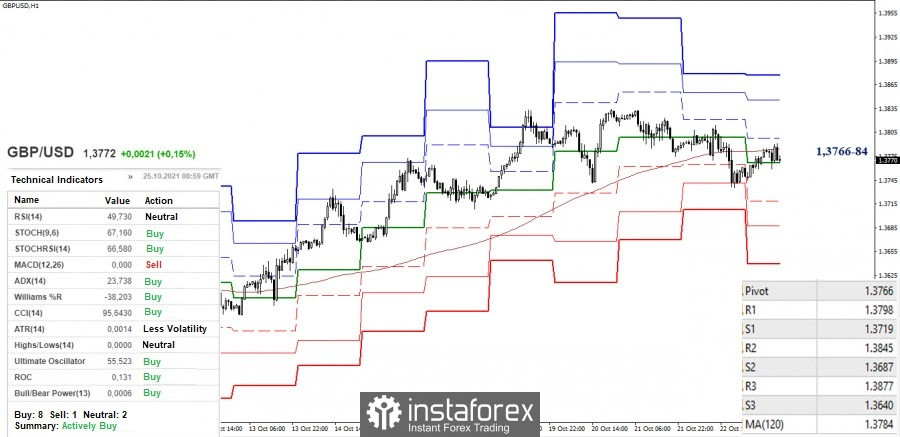
There is a struggle to reach the key levels in the smaller timeframes, which are uniting in the area of 1.3766-84 (central pivot level + weekly long-term trend). The continuation of the decline after the update of the low (1.3735) will open the way to the supports of the classic pivot levels (1.3719 - 1.3687 - 1.3640). On the contrary, a consolidation above the range of 1.3766-84 will set the task to recover the upward trend (1.3834). The resistances of the classic pivot levels 1.3845 and 1.3877 can be the additional upward pivot points within the day.
***
Ichimoku Kinko Hyo (9.26.52) and Kijun-sen levels in the higher time frames, as well as classic Pivot Points and Moving Average (120) on the H1 chart, are used in the technical analysis of the trading instruments.
You have already liked this post today
*บทวิเคราะห์ในตลาดที่มีการโพสต์ตรงนี้ เพียงเพื่อทำให้คุณทราบถึงข้อมูล ไม่ได้เป็นการเจาะจงถึงขั้นตอนให้คุณทำการซื้อขายตาม
ในช่วงต้นของตลาดอเมริกา ราคาทองคำกำลังซื้อขายอยู่ราว ๆ 3,282 โดยเกิดการกลับตัวทางเทคนิคอย่างรุนแรงหลังจากที่เคยขึ้นไปสูงสุดที่ 3,244 เพียงไม่นานหลังจากปิดช่องว่างที่เกิดขึ้นเมื่อวันที่ 8 พฤษภาคม ทองคำอาจจะยังมีแนวโน้มที่ลดลงต่อเนื่องในชั่วโมงต่อ ๆ ไป แต่หากราคาลดลงต่ำกว่าแนวรับ 6/8
Bitcoin ได้ขึ้นไปแตะที่ระดับสูงกว่า $111,850 ใกล้กับพื้นที่ +2/8 Murray ซึ่งเป็นโซนที่ราคาเกินระดับที่แนะนำอย่างสุดขั้ว ในอีกไม่กี่วันข้างหน้า Bitcoin อาจมีความเสี่ยงที่จะปรับลดลงอย่างรวดเร็ว และมีโอกาสลงไปที่ก้นของช่องแนวโน้มขาขึ้นบริเวณประมาณ 106,250 และอาจลงไปถึงระดับเส้นค่าเฉลี่ย
EUR/USD กำลังซื้อขายอยู่ที่ประมาณ 1.1287 หลังจากพยายามที่จะทะลุขอบบนของแนวโน้มขาลง ขณะนี้เครื่องมือได้ทำการปรับตัวอยู่รอบๆ เส้นค่าเฉลี่ยเคลื่อนที่ 21 ช่วงซึ่งบ่งชี้ว่าอาจจะมีการตกลงต่อไปในอีกไม่กี่วันข้างหน้า ยูโรอาจจะดีดตัวขึ้นที่บริเวณ 1.1286 เนื่องจากพื้นที่นี้มีการสนับสนุนที่สำคัญมาตั้งแต่ปลายเดือนเมษายน หากยูโรสามารถปรับตัวขึ้นเหนือระดับนี้ เราอาจคาดว่าจะเห็นมันไปถึงระดับ 1.1367 อีกครั้ง
ในวันพุธ คู่เงิน EUR/USD ยังคงปรับตัวขึ้นและยืนเหนือระดับ 50.0% ของ Fibonacci retracement ที่ 1.1320 เป็นผลให้ค่าเงินยูโรอาจยังคงปรับตัวขึ้นต่อไปสู่แนวต้านถัดไปที่โซน 1.1374–1.1380 การยืนต่ำกว่า 1.1320 จะเป็นการหนุนค่าเงินดอลลาร์สหรัฐและทำให้เกิดการปรับตัวลงสู่โซนแนวรับที่
ในกราฟรายชั่วโมง คู่เงิน GBP/USD ยังคงปรับตัวสูงขึ้นในวันพุธ โดยปิดสิ้นวันที่ระดับใกล้เคียงกับ 1.3425 เพียงแค่สองสามสัปดาห์ที่ผ่านมา ยังไม่มีสัญญาณของการขายดอลลาร์ออกมาอีก แต่ความหวังของนักเทรดเกี่ยวกับข้อตกลงระหว่างสหรัฐฯ–จีนได้หายไปอย่างรวดเร็ว การเคลื่อนไหวขาขึ้นของเงินปอนด์อาจดำเนินต่อไปสู่ระดับ Fibonacci retracement ถัดไปที่ 161.8% –
ลิงก์ที่มีประโยชน์: คุณสามารถอ่านบทความอื่นของฉันได้ในส่วนนี้ คอร์สสำหรับผู้เริ่มต้นของ InstaForex ระบบวิเคราะห์ที่เป็นที่นิยม เปิดบัญชีซื้อขาย สำคัญ: ผู้เริ่มต้นในตลาดฟอเร็กซ์ควรระมัดระวังอย่างมากเมื่อทำการตัดสินใจเกี่ยวกับการเข้าสู่ตลาด ก่อนการเปิดเผยรายงานสำคัญ ๆ ควรหลีกเลี่ยงการอยู่ในตลาดเพื่อลดความเสี่ยงจากการถูกอิทธิพลของความผันผวน หากคุณตัดสินใจเทรดในช่วงที่มีการเผยแพร่ข่าวสาร ควรตั้งค่า stop orders
ราคาของ Bitcoin พุ่งสูงขึ้นไปแตะจุดสูงสุดใหม่ที่ระดับ $111,000 แต่กลับไม่สามารถยืนอยู่เหนือระดับดังกล่าวได้ เหรียญนี้รวมถึงตลาดคริปโตโดยรวมยังคงได้รับการสนับสนุนจากการอ่อนตัวของดอลลาร์ในช่วงที่ผลตอบแทนจากพันธบัตรคลังสหรัฐฯ เพิ่มขึ้นและการเปลี่ยนแปลงทางการเงินของระบบภาษีสหรัฐฯ ที่อาจนำไปสู่การเพิ่มขึ้นของความต้องการเหรียญนี้ในระยะยาว ในมุมมองทางเทคนิค ปัจจุบัน Bitcoin อยู่ในสภาวะที่มีการซื้อมากเกินไปและอาจเกิดการปรับฐานลง เนื่องจากยังไม่สามารถยืนเหนือระดับ $111,000 ได้
ด้วยการเกิดดิเวอร์เจนซ์ระหว่างการเคลื่อนไหวของดัชนี Nasdaq 100 ซึ่งสร้างรูปแบบ Double Top กับตัวชี้วัด Stochastic Oscillator พร้อมการยืนยันจากการเคลื่อนไหวของราคา ซึ่งเคลื่อนที่ต่ำกว่า WMA (21) ที่มีการลาดลงในกราฟ
ขณะที่เรากำลังดูกราฟ 4 ชั่วโมงของคู่เงินหลัก USD/CHF จะเห็นข้อมูลที่น่าสนใจบางอย่างปรากฏขึ้น คือประการแรกการเกิด Divergence ระหว่างการเคลื่อนไหวของราคา USD/CHF กับตัวบ่งชี้ Stochastic Oscillator ประการที่สองการปรากฏขึ้นของรูปแบบ Bearish
เมื่อวันพุธที่ผ่านมา ยูโรสามารถปรับตัวเหนือระดับ 1.1266 และเหนือเส้นดัชนีสมดุลได้สำเร็จ ระดับเป้าหมายถัดไปคือ 1.1420 และ 1.1535 ออสซิลเลเตอร์ Marlin กำลังจะเข้าสู่พื้นที่ของแรงขับเคลื่อนแนวโน้มขาขึ้น วันนี้ มีการคาดการณ์ว่ารายงานทางเศรษฐกิจที่แข็งแกร่งจะออกมาจากกลุ่มประเทศยูโรโซน ดัชนีความคาดหวังทางธุรกิจ
อีเมล/SMS
การแจ้งเตือน

Your IP address shows that you are currently located in the USA. If you are a resident of the United States, you are prohibited from using the services of InstaFintech Group including online trading, online transfers, deposit/withdrawal of funds, etc.
If you think you are seeing this message by mistake and your location is not the US, kindly proceed to the website. Otherwise, you must leave the website in order to comply with government restrictions.
Why does your IP address show your location as the USA?
Please confirm whether you are a US resident or not by clicking the relevant button below. If you choose the wrong option, being a US resident, you will not be able to open an account with InstaTrade anyway.
We are sorry for any inconvenience caused by this message.


