อ่านรายละเอียดเพิ่มเติม


 04.10.2021 01:45 PM
BITCOIN
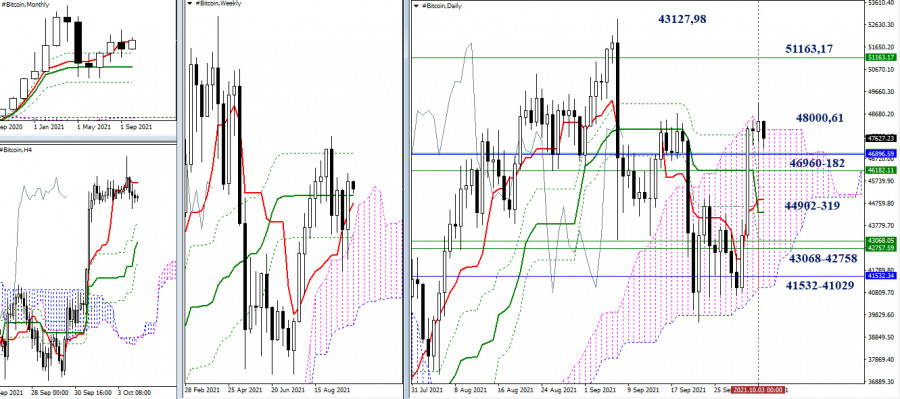
The previous week managed to confirm and strengthen the rebound from the encountered accumulation of support levels. This became possible due to the consolidation above the zone, which is formed by associations of different levels. So, for example, it is possible to designate and highlight the areas of 46182.11 - 46960.39 (weekly Tenkan + weekly Kijun + monthly Tenkan); 44901.61 - 44318.86 (daily Tenkan + daily Kijun); 43068.05 - 42757.59 (upper border of the weekly cloud + weekly Fibo Kijun + daily Fibo Kijun) and 41532.34 - 41028.86 (monthly Fibo Kijun + lower border of the daily cloud).
These accumulations of levels currently retain the role of supports, and as before, they will try to defend the bullish interests when interacting and testing. Today, the current attraction on the daily timeframe continues to resist the upper border of the daily Ichimoku cloud (48000.61). Consolidation in the bullish zone relative to the daily cloud will set the following tasks for the bulls – breaking through the weekly dead Ichimoku cross (51163.17) and updating the maximum extremum (43127.98).
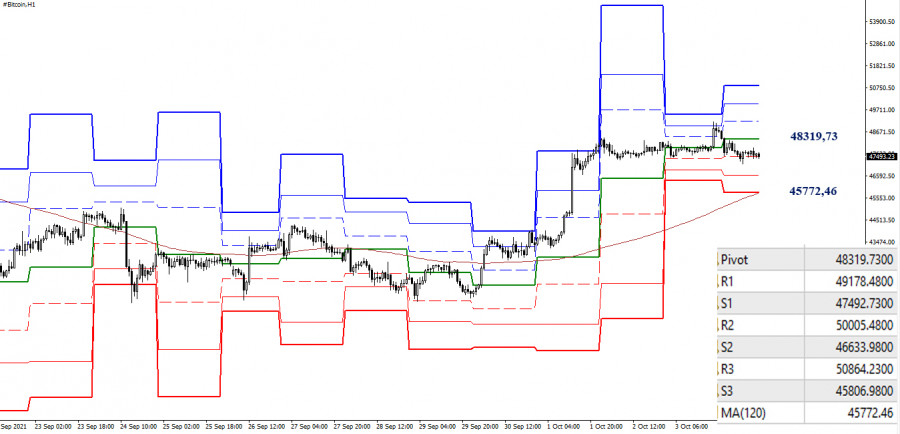
The main advantage in the smaller timeframes continues to be on the bulls' side. However, the price has been in the correction zone for a long time, and bearish traders were able to consolidate below the central pivot level of the day (48319.73) today. It should be noted that another decline will lead to testing of the key level – the weekly long-term trend (45772.46). The nearest support on this path can be noted today at 46633.98 (S2).
In turn, the breakdown and reversal of the moving (45772.46) will change the current balance of power in the same timeframe. In this case, it would be better to re-evaluate the situation and prospects. The interests of the bulls may be represented by the resistance levels of 48319.73 - 49178.48 - 50005.48 - 50864.23 (classic pivot levels).
***
Ichimoku Kinko Hyo (9.26.52) and Kijun-sen levels in the higher time frames, as well as classic Pivot Points and Moving Average (120) on the H1 chart, are used in the technical analysis of this cryptocurrency.
You have already liked this post today
*บทวิเคราะห์ในตลาดที่มีการโพสต์ตรงนี้ เพียงเพื่อทำให้คุณทราบถึงข้อมูล ไม่ได้เป็นการเจาะจงถึงขั้นตอนให้คุณทำการซื้อขายตาม
ดูเหมือนว่าการเคลื่อนไหวของราคาของ Doge Cryptocurrency ในกราฟ 4 ชั่วโมง กำลังเคลื่อนที่เหนือ WMA (21) ซึ่งมีความชันขึ้นไปด้านบน และตัวบ่งชี้ Stochastic Oscillator กำลังพร้อมที่จะข้ามสัญญาณซื้อ (BUY)
หากเราดูที่กราฟ 4 ชั่วโมงของสกุลเงินดิจิทัล Ripple จะเห็นได้ว่ามันเคลื่อนตัวขึ้นเหนือ WMA (21) ซึ่งมีความชันสูงและประสบความสำเร็จในการทะลุขึ้นเหนือระดับ High Value Area (สีเหลือง) แล้วต่อไปเคลื่อนตัวขึ้นเหนือพื้นที่สีน้ำเงิน (ค่าเฉลี่ย) และอยู่ในพื้นที่ที่มีอารมณ์ของผู้ซื้อซึ่งค่อนข้างมาก
ในวันพฤหัสบดี ราคาของ Bitcoin ได้แตะระดับเป้าหมายที่ 111,770 การแกว่งตัวของออสซิลเลเตอร์ Marlin ดูเหมือนจะตามหลังราคาอยู่ ทำให้เกิดภาพของการแยกตัวที่ไม่เป็นไปตามมาตรฐานชั้นสูง แต่ในขณะนี้ เรายังคงยึดตามสถานการณ์ที่ออสซิลเลเตอร์จะพัฒนาอยู่ภายในช่องแนวโน้มขึ้นระยะยาว การปรับฐานจากระดับปัจจุบันมีความเป็นไปได้อย่างแน่นอน ระดับอ้างอิงคือ 109,985 ซึ่งเป็นระดับสูงสุดเมื่อวันที่
เมื่อวันที่ 22 พฤษภาคม Bitcoin ได้ทะลุผ่านระดับ $111,888 อย่างมั่นใจ ทำให้เกิดสถิติใหม่สูงสุดที่ $111,867 ซึ่งไม่เหมือนกับการพุ่งทะยานครั้งก่อนที่มีการเฉลิมฉลองจากนักลงทุนรายย่อย แต่ครั้งนี้พฤติกรรมของตลาดมีความแตกต่างออกไป ผู้เข้าร่วมในตลาดกำลังพูดกันมากขึ้นไม่ใช่เกี่ยวกับความคลั่งไคล้ในการเก็งกำไร แต่เกี่ยวกับการเปลี่ยนแปลงพื้นฐานในการมอง Bitcoin ในโลกการเงิน
ดูเหมือนว่าความต้องการ Bitcoin กำลังเพิ่มขึ้นอย่างรวดเร็ว เมื่อพิจารณาจากประสิทธิภาพล่าสุด ขณะที่เผยแพร่บทความนี้ คู่ BTC/USD ซื้อขายอยู่ใกล้ 111,200.00 ซึ่งลดลงเล็กน้อยจากราคาสูงสุดของวันนี้และราคาสูงสุดตลอดกาลที่ 111,865.00 โดยรวมในเดือนที่ยังคงดำเนินอยู่นี้ ราคาขึ้น 18% ทำลายสถิติเดิมที่
บิทคอยน์กำลังเคลื่อนที่เข้าใกล้จุดสูงสุดตลอดกาลของมันอย่างมั่นคง และตามที่นักวิเคราะห์หลายท่านกล่าวไว้ มันพร้อมที่จะสร้างสถิติใหม่ ระดับปัจจุบันที่ใกล้เคียง $105,000 ไม่ได้เป็นเพียงแค่ตัวเลข — แต่มันบ่งบอกว่าสินทรัพย์คริปโตนี้กำลังกลับมาแข็งแกร่งอีกครั้ง กระตุ้นความสนใจจากทั้งนักเทรดทั่วไปและสถาบันต่างๆ แต่ภายใต้การเคลื่อนที่ที่มั่นใจนี้กลับมีความซับซ้อนแฝงอยู่ นี่คือการวิเคราะห์ว่าทำไมตลาดจึงเชื่อใน $115,000 — และสิ่งที่อาจผิดพลาดได้ สถานการณ์ที่กลัวที่สุดของฝั่งกระทิง—การเกิดจุดสูงสุดสองเท่า—ได้กลายเป็นหัวข้อร้อนแรง
ลายเส้นคลื่นบนกราฟ 4 ชั่วโมงสำหรับ BTC/USD ได้กลายเป็นซับซ้อนมากขึ้นในเดือนที่ผ่านมา ความกระทบทางด้านลงต่ำเราสังเกตว่ามีการสร้างโครงสร้างลงที่สำเร็จตอนที่ระดับ 75,000 ดังนั้นจึงตามมาด้วยการเคลื่อนขึ้นอย่างแข็งแกร่ง ซึ่งอาจทำเครื่องหมายว่าจุดเริ่มต้นของแนวโน้มกระตุ้นใหม่ คลื่นแรกของส่วนพวกนี้ดูเหมือนว่าจะสมบูรณ์ แต่คลื่นที่สองดูเล็กมากและไม่น่าเชื่อถือเลย พื้นหลังข่าวสนับสนุน Bitcoin แต่บางทีก็ไม่ค่อยจะเสมอและคง่งหมั่น ผมจะขอพูดว่าผู้มีส่วนร่วมในตลาดตัวเองตีความความสัมพันธ์ใด
หากเราดูที่กราฟ 4 ชั่วโมง สกุลเงินคริปโต Ethereum ดูเหมือนจะเคลื่อนไหวเหนือ WMA (21) ซึ่งเป็นแนวรับแบบไดนามิกที่ WMA มีความลาดเอียงเพิ่มขึ้น ดังนั้นจากข้อมูลนี้จึงเป็นการบ่งชี้ว่าในอีกไม่กี่วันข้างหน้า #ETH มีศักยภาพที่จะมีการแข็งค่าต่อได้ โดยระดับ
ในกราฟ 4 ชั่วโมง สกุลเงินดิจิทัล Uniswap ดูเหมือนว่าจะมีรูปแบบ Descending Broadening Wedge ดังนั้นถึงแม้ว่าการเคลื่อนไหวของราคา Uniswap กำลังเคลื่อนตัวต่ำกว่าสาย WMA (21) ที่มีแนวลาดลงก็ตาม
Bitcoin พุ่งขึ้นไปที่ $104,500 หลังจากที่พึ่งซื้อขายอยู่ที่ $96,600 ในเช้าวันเมื่อวานนี้ เทรนด์ที่พุ่งขึ้นอย่างมั่นคงเหนือเครื่องหมาย $100,000 นี้ แสดงถึงการกลับมาของแรงซื้อมากขึ้นในตลาดคริปโตเคอเรนซีอย่างชัดเจน ในขณะที่นักเทรดและนักลงทุนกำลังขี่คลื่นแห่งความสนุกสนาน ดัชนีกลัวและโลภของคริปโตได้เพิ่มขึ้นเป็น 73 จุด
วิดีโอแนะนำการฝึก

Your IP address shows that you are currently located in the USA. If you are a resident of the United States, you are prohibited from using the services of InstaFintech Group including online trading, online transfers, deposit/withdrawal of funds, etc.
If you think you are seeing this message by mistake and your location is not the US, kindly proceed to the website. Otherwise, you must leave the website in order to comply with government restrictions.
Why does your IP address show your location as the USA?
Please confirm whether you are a US resident or not by clicking the relevant button below. If you choose the wrong option, being a US resident, you will not be able to open an account with InstaTrade anyway.
We are sorry for any inconvenience caused by this message.


