

Patrones actuales

Los patrones son modelos gráficos que se forman en el gráfico mediante el precio. Según uno de los postulados del análisis técnico, la historia (movimiento del precio) se repite. Esto quiere decir que los movimientos del precio a menudo son similares en las mismas situaciones que hacen posible pronosticar el futuro desarrollo de la situación con una alta probabilidad.
Los patrones relevantes de InstaTrade son un servicio fácil de utilizar que permiten que conozca los últimos cambios en el mercado y reaccione a las pistas del mercado a tiempo. En nuestro servicio, siempre encontrará los últimos y más importantes patrones en cualquier par y en cualquier marco de tiempo.
Triple Bottom
was formed on 18.04 at 16:30:12 (UTC+0)
signal strength 3 of 5
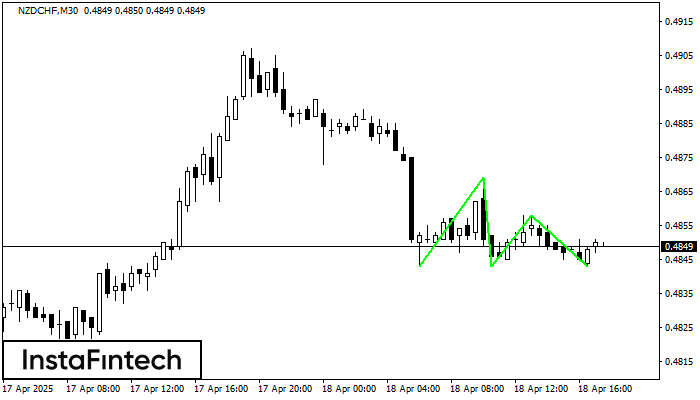
The Triple Bottom pattern has formed on the chart of the NZDCHF M30 trading instrument. The pattern signals a change in the trend from downwards to upwards in the case of breakdown of 0.4869/0.4858.
Vea asimismo
- All
- All
- Bearish Rectangle
- Bearish Symmetrical Triangle
- Bearish Symmetrical Triangle
- Bullish Rectangle
- Double Top
- Double Top
- Triple Bottom
- Triple Bottom
- Triple Top
- Triple Top
- All
- All
- Buy
- Sale
- All
- 1
- 2
- 3
- 4
- 5
Triángulo Simétrico Bajista
was formed on 01.05 at 01:16:49 (UTC+0)
signal strength 2 of 5
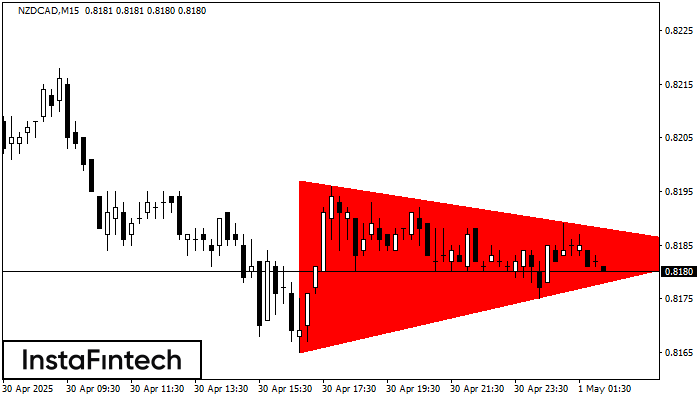
Según el gráfico de M15, el NZDCAD formó el patrón Triángulo Simétrico Bajista. Descripción: El límite inferior es 0.8165/0.8184 y el límite superior es 0.8197/0.8184. El ancho del patrón
Los marcos de tiempo M5 y M15 pueden tener más puntos de entrada falsos.
Open chart in a new window
Doble Techo
was formed on 01.05 at 01:15:25 (UTC+0)
signal strength 2 of 5
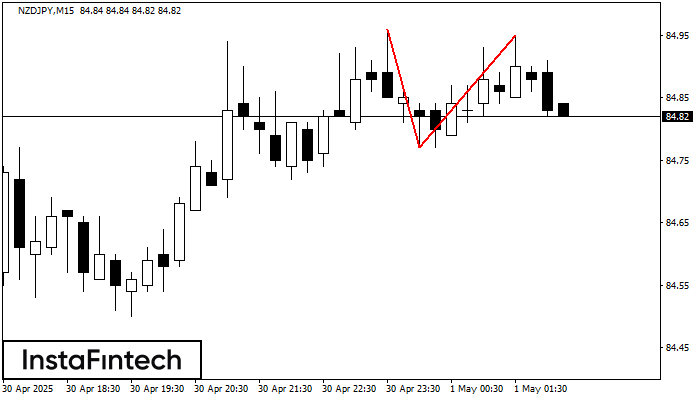
En el gráfico de NZDJPY M15 el patrón de reversión Doble Techo ha sido formado. Características: límite superior 84.95; límite inferior 84.77; el ancho del patrón 18 puntos. La señal
Los marcos de tiempo M5 y M15 pueden tener más puntos de entrada falsos.
Open chart in a new window
Doble Techo
was formed on 01.05 at 01:15:22 (UTC+0)
signal strength 2 of 5
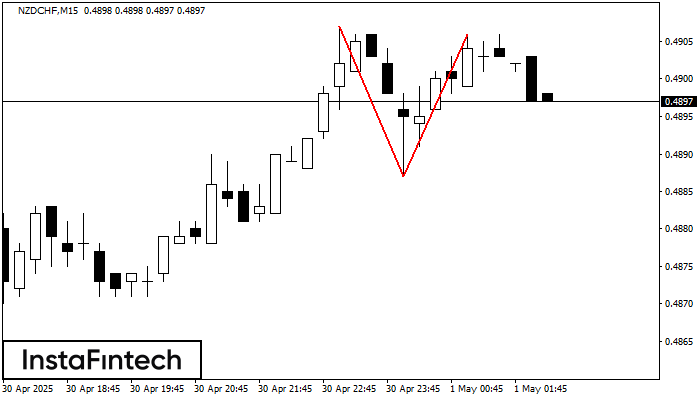
El patrón de reversión Doble Techo ha sido formado en NZDCHF M15. Características: el límite superior 0.4907; el límite inferior 0.4887; el ancho del patrón es 19 puntos. Es mejor
Los marcos de tiempo M5 y M15 pueden tener más puntos de entrada falsos.
Open chart in a new window


