

Patrones actuales

Los patrones son modelos gráficos que se forman en el gráfico mediante el precio. Según uno de los postulados del análisis técnico, la historia (movimiento del precio) se repite. Esto quiere decir que los movimientos del precio a menudo son similares en las mismas situaciones que hacen posible pronosticar el futuro desarrollo de la situación con una alta probabilidad.
Los patrones relevantes de InstaTrade son un servicio fácil de utilizar que permiten que conozca los últimos cambios en el mercado y reaccione a las pistas del mercado a tiempo. En nuestro servicio, siempre encontrará los últimos y más importantes patrones en cualquier par y en cualquier marco de tiempo.
Head and Shoulders
was formed on 17.04 at 14:00:03 (UTC+0)
signal strength 2 of 5

The technical pattern called Head and Shoulders has appeared on the chart of EURCHF M15. There are weighty reasons to suggest that the price will surpass the Neckline 0.9278/0.9279 after the right shoulder has been formed. So, the trend is set to change with the price heading for 0.9257.
The M5 and M15 time frames may have more false entry points.
Vea asimismo
- All
- All
- Bearish Rectangle
- Bearish Symmetrical Triangle
- Bearish Symmetrical Triangle
- Bullish Rectangle
- Double Top
- Double Top
- Triple Bottom
- Triple Bottom
- Triple Top
- Triple Top
- All
- All
- Buy
- Sale
- All
- 1
- 2
- 3
- 4
- 5
Triángulo Simétrico Bajista
was formed on 30.05 at 00:39:15 (UTC+0)
signal strength 3 of 5
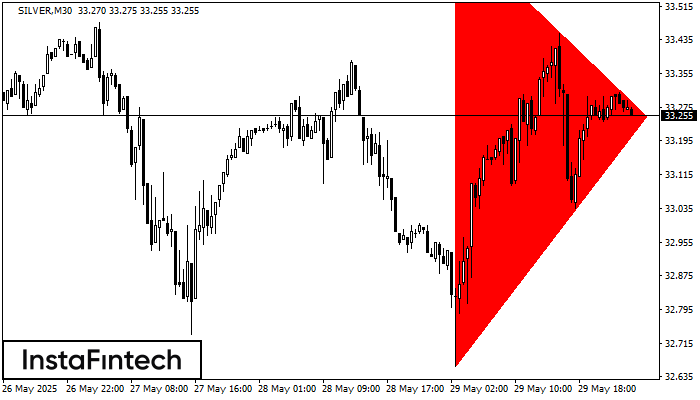
Según el gráfico de M30, el SILVER formó el patrón Triángulo Simétrico Bajista. Recomendaciones de negociación: es posible que una ruptura del límite inferior 32.66 fomente una continuación
Open chart in a new window
Triángulo Simétrico Bajista
was formed on 26.05 at 07:35:04 (UTC+0)
signal strength 3 of 5
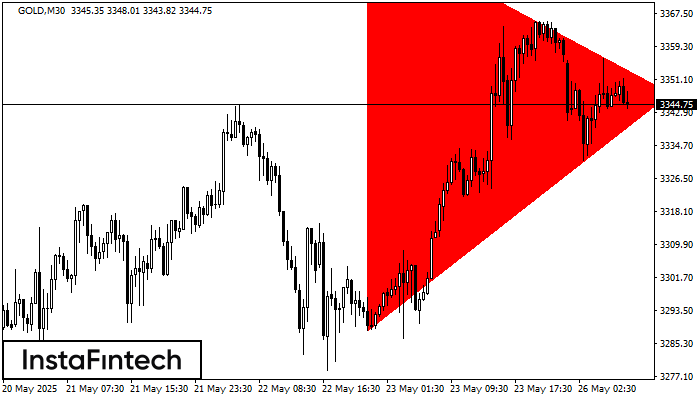
Según el gráfico de M30, el GOLD formó el patrón Triángulo Simétrico Bajista. Descripción: El límite inferior es 3288.62/3347.68 y el límite superior es 3388.17/3347.68. El ancho del patrón
Open chart in a new window
Triángulo Simétrico Bajista
was formed on 23.05 at 08:32:20 (UTC+0)
signal strength 3 of 5
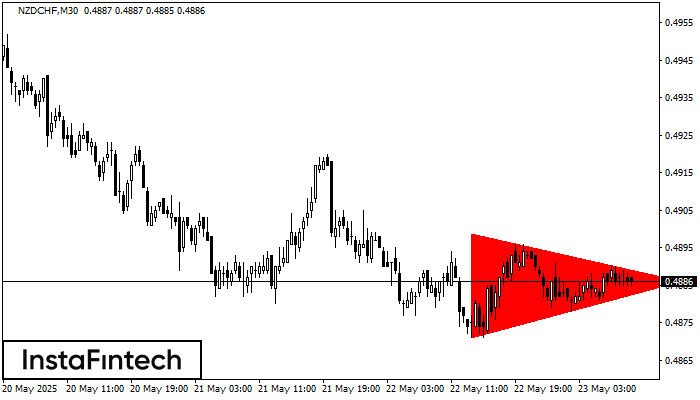
Según el gráfico de M30, el NZDCHF formó el patrón Triángulo Simétrico Bajista. Descripción: El límite inferior es 0.4871/0.4886 y el límite superior es 0.4899/0.4886. El ancho del patrón
Open chart in a new window


