

Patrones actuales

Los patrones son modelos gráficos que se forman en el gráfico mediante el precio. Según uno de los postulados del análisis técnico, la historia (movimiento del precio) se repite. Esto quiere decir que los movimientos del precio a menudo son similares en las mismas situaciones que hacen posible pronosticar el futuro desarrollo de la situación con una alta probabilidad.
Los patrones relevantes de InstaTrade son un servicio fácil de utilizar que permiten que conozca los últimos cambios en el mercado y reaccione a las pistas del mercado a tiempo. En nuestro servicio, siempre encontrará los últimos y más importantes patrones en cualquier par y en cualquier marco de tiempo.
Double Bottom
was formed on 24.03 at 18:55:15 (UTC+0)
signal strength 1 of 5
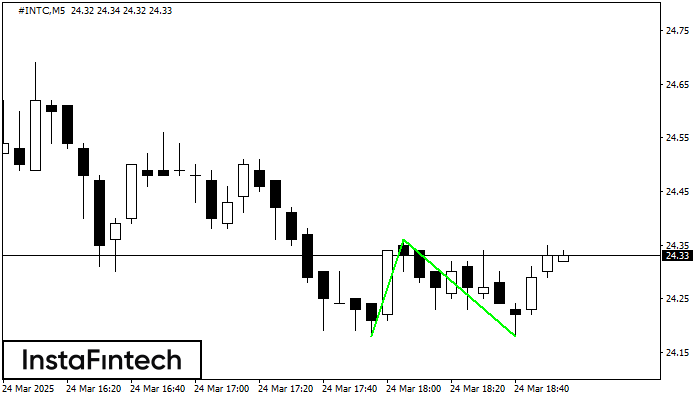
The Double Bottom pattern has been formed on #INTC M5. Characteristics: the support level 24.18; the resistance level 24.36; the width of the pattern 18 points. If the resistance level is broken, a change in the trend can be predicted with the first target point lying at the distance of 18 points.
The M5 and M15 time frames may have more false entry points.
Vea asimismo
- All
- All
- Bearish Rectangle
- Bearish Symmetrical Triangle
- Bearish Symmetrical Triangle
- Bullish Rectangle
- Double Top
- Double Top
- Triple Bottom
- Triple Bottom
- Triple Top
- Triple Top
- All
- All
- Buy
- Sale
- All
- 1
- 2
- 3
- 4
- 5
Bullish Rectangle
was formed on 02.06 at 06:00:14 (UTC+0)
signal strength 2 of 5
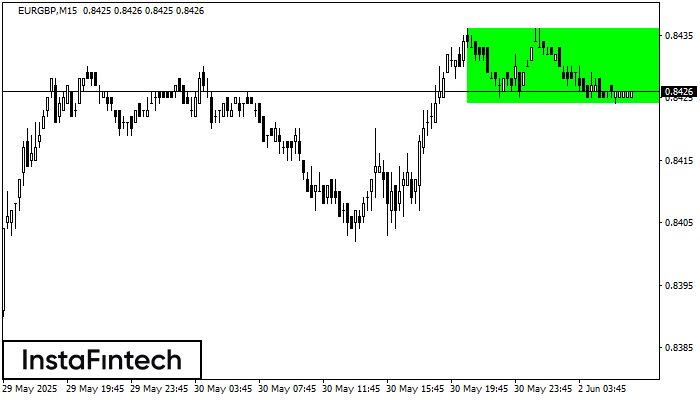
According to the chart of M15, EURGBP formed the Bullish Rectangle. This type of a pattern indicates a trend continuation. It consists of two levels: resistance 0.8436 and support 0.8424
The M5 and M15 time frames may have more false entry points.
Open chart in a new window
Triple Bottom
was formed on 02.06 at 06:00:03 (UTC+0)
signal strength 4 of 5
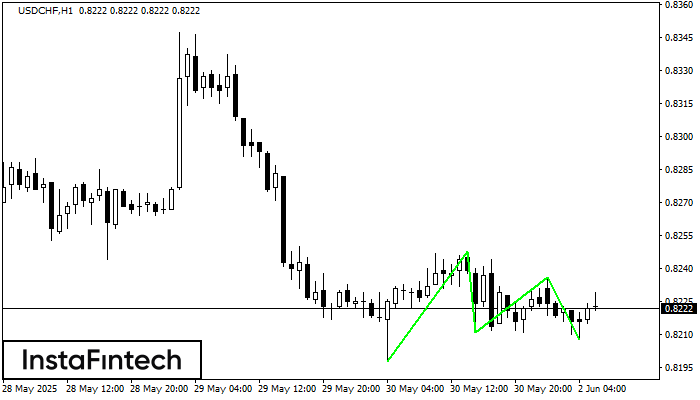
The Triple Bottom pattern has formed on the chart of the USDCHF H1 trading instrument. The pattern signals a change in the trend from downwards to upwards in the case
Open chart in a new window
Triple Bottom
was formed on 02.06 at 05:50:03 (UTC+0)
signal strength 1 of 5
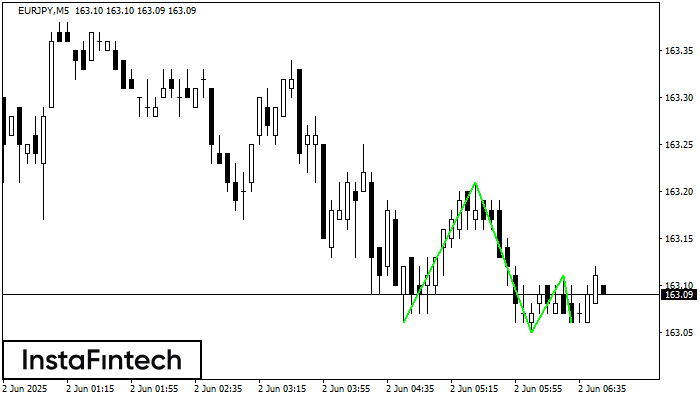
The Triple Bottom pattern has been formed on EURJPY M5. It has the following characteristics: resistance level 163.21/163.11; support level 163.06/163.06; the width is 15 points. In the event
The M5 and M15 time frames may have more false entry points.
Open chart in a new window


