Vea también


 29.11.2023 06:20 PM
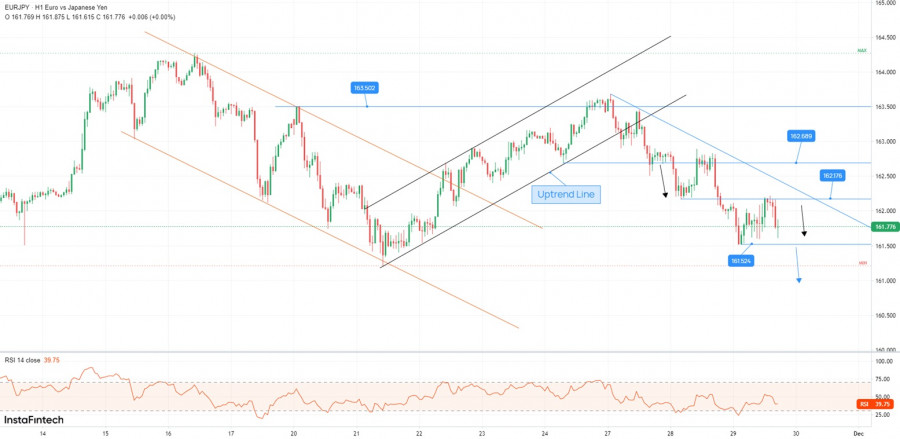
The EUR/JPY pair is trading in the red at 161.72 at the time of writing and it seems very heavy in the short term. The bias remains bearish, so more declines are expected. Still, a downside needs confirmation.
Fundamentally, the German Prelim CPI reported a 0.4% drop, more compared to the 0.1% drop expected, while Spanish Flash CPI rose by 3.2%, less compared to the 3.6% growth estimated.
Tomorrow, Japan is to release Housing Starts, Consumer Confidence, Retail Sales, and Prelim Industrial Production data. On the other hand, the Eurozone CPI Flash Estimated, Core CPI Flash Estimate, German Unemployment Change, and German Retail Sales figures.
Technically, the rate developed a new leg down after escaping from the up channel pattern. It has found temporary support on 161.52 and it has turned to the upside to retest the 162.17 static resistance (support turned into resistance).
Now, it challenges the 161.52 former low which represents a static support. Its failure to test and retest the downtrend line signaled strong downside pressure.
A bearish closure below 161.52 activates more declines. This is seen as a new selling opportunity.
You have already liked this post today
*El análisis de mercado publicado aquí tiene la finalidad de incrementar su conocimiento, más no darle instrucciones para realizar una operación.
GBP/USD: plan para la sesión europea del 22 de abril. Informes Commitment of Traders (COT) (análisis de las operaciones de ayer). La libra no pierde la esperanza de un nuevo
Ayer se formaron varios puntos de entrada al mercado. Veamos el gráfico de 5 minutos y analicemos qué sucedió. En mi pronóstico de la mañana presté atención al nivel
Ayer no se formaron puntos de entrada normales al mercado. Veamos el gráfico de 5 minutos y analicemos lo que ocurrió. En mi pronóstico matutino llamé la atención sobre
Ayer se formaron varios puntos de entrada al mercado. Veamos el gráfico de 5 minutos y analicemos lo que sucedió. En mi pronóstico matutino llamé la atención sobre el nivel
Ayer no se formaron puntos de entrada normales al mercado. Veamos el gráfico de 5 minutos y analicemos lo que ocurrió. En mi pronóstico matutino presté atención al nivel
Ayer se formaron varios puntos de entrada al mercado. Veamos el gráfico de 5 minutos y analicemos lo que ocurrió. En mi pronóstico matutino presté atención al nivel de 1.1341
Ayer no se formaron puntos normales de entrada al mercado. Veamos el gráfico de 5 minutos y analicemos lo que sucedió. En mi pronóstico matutino presté atención al nivel
Ayer se formaron varios puntos de entrada al mercado. Veamos el gráfico de 5 minutos y analicemos lo que sucedió. En mi pronóstico matutino presté atención al nivel de 1.1377
Ayer se formaron varios puntos de entrada al mercado. Veamos el gráfico de 5 minutos y analicemos lo que ocurrió. En mi pronóstico matutino presté atención al nivel de 1.2842
Ayer se formaron varios puntos de entrada al mercado. Veamos el gráfico de 5 minutos y analicemos lo que ocurrió. En mi pronóstico matutino presté atención al nivel de 1.1086
Gráfico Forex
versión web

Your IP address shows that you are currently located in the USA. If you are a resident of the United States, you are prohibited from using the services of InstaFintech Group including online trading, online transfers, deposit/withdrawal of funds, etc.
If you think you are seeing this message by mistake and your location is not the US, kindly proceed to the website. Otherwise, you must leave the website in order to comply with government restrictions.
Why does your IP address show your location as the USA?
Please confirm whether you are a US resident or not by clicking the relevant button below. If you choose the wrong option, being a US resident, you will not be able to open an account with InstaTrade anyway.
We are sorry for any inconvenience caused by this message.

