Актуальные паттерны

Паттерны – это графические модели, которые "рисует" цена на графике. Один из постулатов технического анализа говорит нам о том, что история (движение цены) всегда повторяется. Это значит, что в похожих ситуациях движение цены, зачастую, будет похожим, что позволяет с высокой долей вероятности спрогнозировать дальнейшее развитие ситуации.
Актуальные паттерны от ИнстаФорекс – это удобный сервис, который позволит вам всегда быть в курсе последних изменений на рынке и вовремя реагировать на появившиеся подсказки от рынка. В нашем сервисе вы всегда найдете самые свежие и актуальные паттерны на любой паре и на любом таймфрейме.
Бычий флаг
сформирован 17.04 в 13:38:24 (UTC+0)
сила сигнала 1 из 5
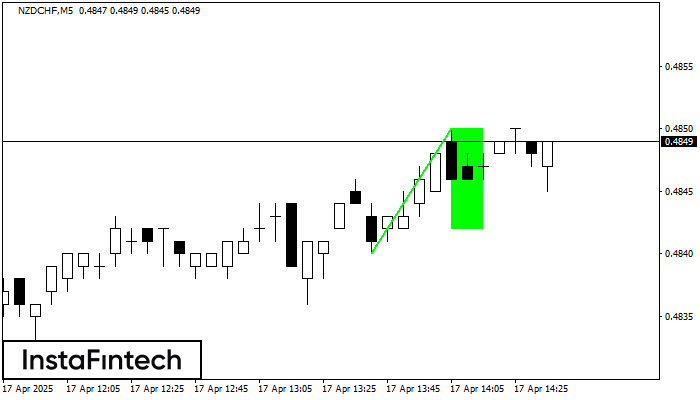
На графике NZDCHF M5 сформировалась фигура «Бычий флаг», которая сигнализирует о продолжении восходящего тренда. Сигналы: Пробой максимума фигуры 0.4850 может привести к продолжению восходящего движения, где рост инструмента будет являться проекцией высоты флагштока.
Таймфреймы М5 и М15 могут иметь больше ложных точек входа.
Смотрите также
- Все
- Все
- Bearish Rectangle
- Bearish Symmetrical Triangle
- Bearish Symmetrical Triangle
- Bullish Rectangle
- Double Top
- Double Top
- Triple Bottom
- Triple Bottom
- Triple Top
- Triple Top
- Все
- Все
- Покупка
- Продажа
- Все
- 1
- 2
- 3
- 4
- 5
Triple Top
сформирован 13.06 в 09:35:44 (UTC+0)
сила сигнала 1 из 5
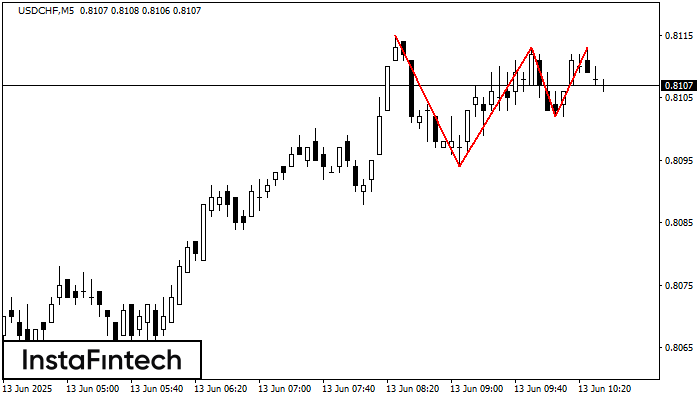
On the chart of the USDCHF M5 trading instrument, the Triple Top pattern that signals a trend change has formed. It is possible that after formation of the third peak
The M5 and M15 time frames may have more false entry points.
Открыть график инструмента в новом окне
Double Bottom
сформирован 13.06 в 09:30:24 (UTC+0)
сила сигнала 3 из 5
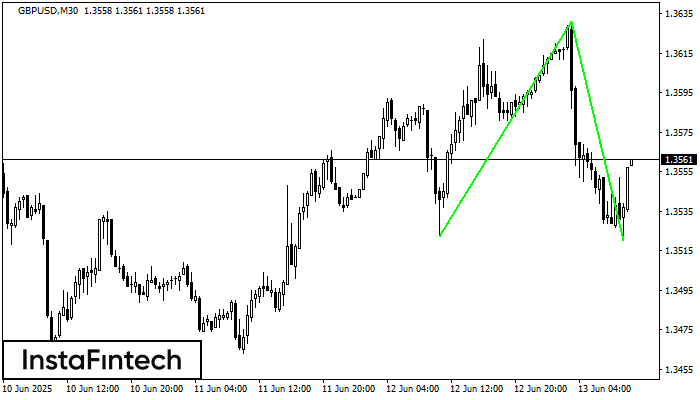
The Double Bottom pattern has been formed on GBPUSD M30. Characteristics: the support level 1.3522; the resistance level 1.3631; the width of the pattern 109 points. If the resistance level
Открыть график инструмента в новом окне
Double Bottom
сформирован 13.06 в 08:15:20 (UTC+0)
сила сигнала 2 из 5
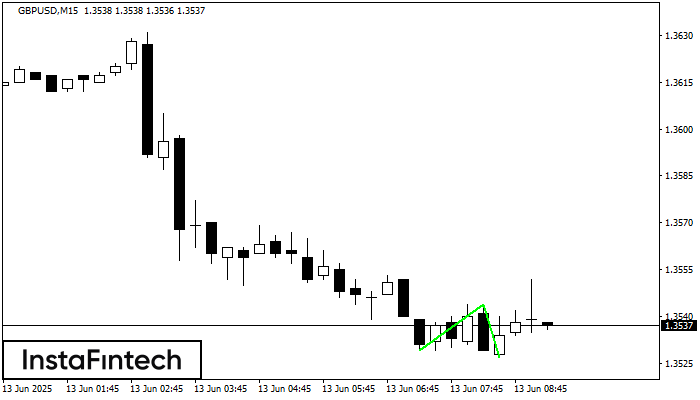
The Double Bottom pattern has been formed on GBPUSD M15. Characteristics: the support level 1.3529; the resistance level 1.3544; the width of the pattern 15 points. If the resistance level
The M5 and M15 time frames may have more false entry points.
Открыть график инструмента в новом окне