Актуальные паттерны

Паттерны – это графические модели, которые "рисует" цена на графике. Один из постулатов технического анализа говорит нам о том, что история (движение цены) всегда повторяется. Это значит, что в похожих ситуациях движение цены, зачастую, будет похожим, что позволяет с высокой долей вероятности спрогнозировать дальнейшее развитие ситуации.
Актуальные паттерны от ИнстаФорекс – это удобный сервис, который позволит вам всегда быть в курсе последних изменений на рынке и вовремя реагировать на появившиеся подсказки от рынка. В нашем сервисе вы всегда найдете самые свежие и актуальные паттерны на любой паре и на любом таймфрейме.
Прямоугольник
сформирован 11.04 в 22:10:27 (UTC+0)
сила сигнала 1 из 5

По торговому инструменту USDCAD на M5 сформировалась фигура продолжения тренда - «Прямоугольник». Фигура имеет границы: Нижняя 1.3871; Верхняя 1.3891. В случае пробоя нижней границы вероятно дальнейшее движение в сторону тренда.
Таймфреймы М5 и М15 могут иметь больше ложных точек входа.
- Все
- Все
- Bearish Rectangle
- Bearish Symmetrical Triangle
- Bearish Symmetrical Triangle
- Bullish Rectangle
- Double Top
- Double Top
- Triple Bottom
- Triple Bottom
- Triple Top
- Triple Top
- Все
- Все
- Покупка
- Продажа
- Все
- 1
- 2
- 3
- 4
- 5
Bullish Rectangle
was formed on 01.05 at 18:33:45 (UTC+0)
signal strength 1 of 5
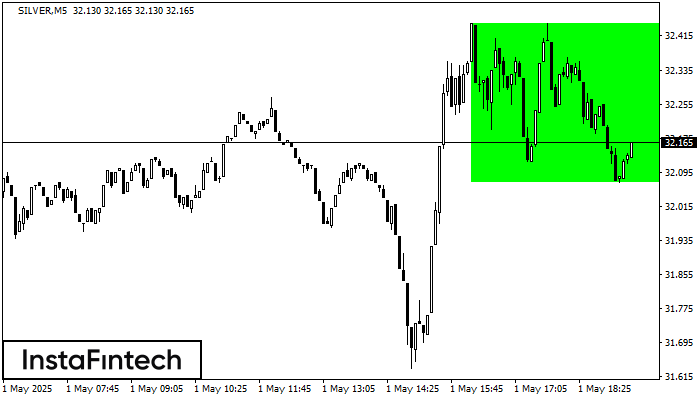
According to the chart of M5, SILVER formed the Bullish Rectangle. The pattern indicates a trend continuation. The upper border is 32.45, the lower border is 32.07. The signal means
The M5 and M15 time frames may have more false entry points.
Open chart in a new window
Double Top
was formed on 01.05 at 18:30:14 (UTC+0)
signal strength 1 of 5
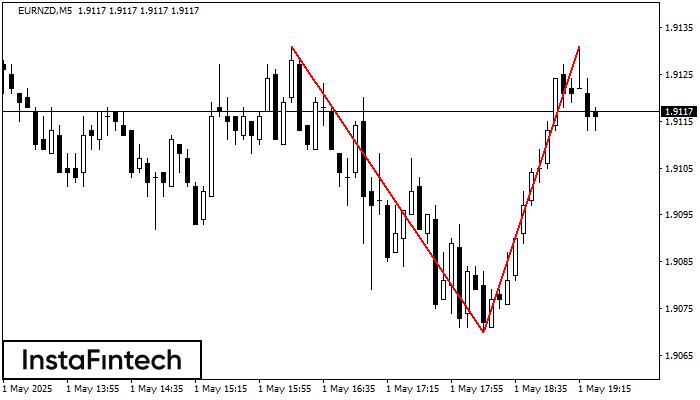
The Double Top reversal pattern has been formed on EURNZD M5. Characteristics: the upper boundary 1.9131; the lower boundary 1.9070; the width of the pattern is 61 points. Sell trades
The M5 and M15 time frames may have more false entry points.
Open chart in a new window
Triple Bottom
was formed on 01.05 at 17:39:48 (UTC+0)
signal strength 1 of 5

The Triple Bottom pattern has been formed on #KO M5. It has the following characteristics: resistance level 71.64/71.57; support level 71.39/71.35; the width is 25 points. In the event
The M5 and M15 time frames may have more false entry points.
Open chart in a new window