

Actual patterns

Patterns are graphical models which are formed in the chart by the price. According to one of the technical analysis postulates, history (price movement) repeats itself. It means that the price movements are often similar in the same situations which makes it possible to predict the further development of the situation with a high probability.
Relevant patterns by InstaTrade is an easy-to-use service which allows you to be aware of latest changes in the market and react to clues from the market in time. In our service you will always find the latest and most relevant patterns on any pair and any timeframe.
Bullish Symmetrical Triangle
was formed on 18.04 at 20:46:25 (UTC+0)
signal strength 1 of 5

According to the chart of M5, EURJPY formed the Bullish Symmetrical Triangle pattern, which signals the trend will continue. Description. The upper border of the pattern touches the coordinates 162.14/161.98 whereas the lower border goes across 161.82/161.98. The pattern width is measured on the chart at 32 pips. If the Bullish Symmetrical Triangle pattern is in progress during the upward trend, this indicates the current trend will go on. In case 161.98 is broken, the price could continue its move toward 162.13.
The M5 and M15 time frames may have more false entry points.
See Also
- All
- All
- Bearish Rectangle
- Bearish Symmetrical Triangle
- Bearish Symmetrical Triangle
- Bullish Rectangle
- Double Top
- Double Top
- Triple Bottom
- Triple Bottom
- Triple Top
- Triple Top
- All
- All
- Buy
- Sale
- All
- 1
- 2
- 3
- 4
- 5
Doble Piso
was formed on 02.06 at 00:05:19 (UTC+0)
signal strength 1 of 5
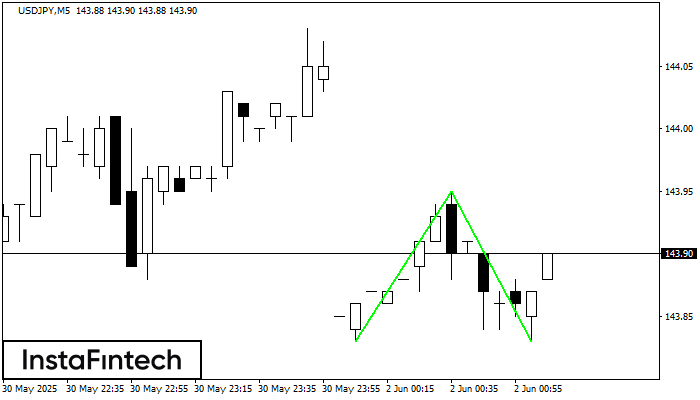
El patrón Doble Piso ha sido formado en USDJPY M5. Esta formación señala una reversión de la tendencia de bajista a alcista. La señal es que se debe abrir
Los marcos de tiempo M5 y M15 pueden tener más puntos de entrada falsos.
Open chart in a new window
Doble Piso
was formed on 01.06 at 23:00:15 (UTC+0)
signal strength 1 of 5
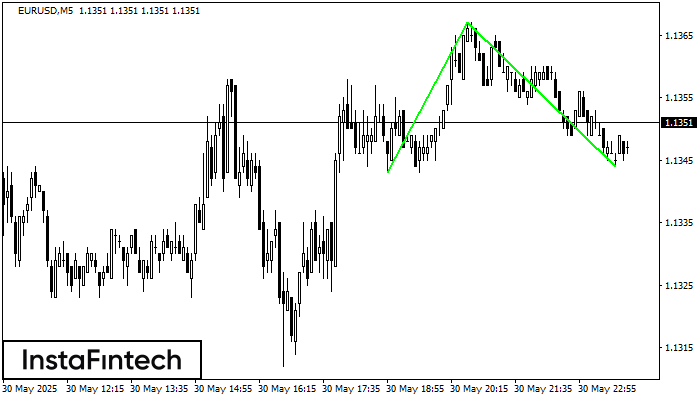
El patrón Doble Piso ha sido formado en EURUSD M5. Características: el nivel de soporte 1.1343; el nivel de resistencia 1.1367; el ancho del patrón 24 puntos. Si el nivel
Los marcos de tiempo M5 y M15 pueden tener más puntos de entrada falsos.
Open chart in a new window
Doble Techo
was formed on 01.06 at 23:00:15 (UTC+0)
signal strength 2 of 5
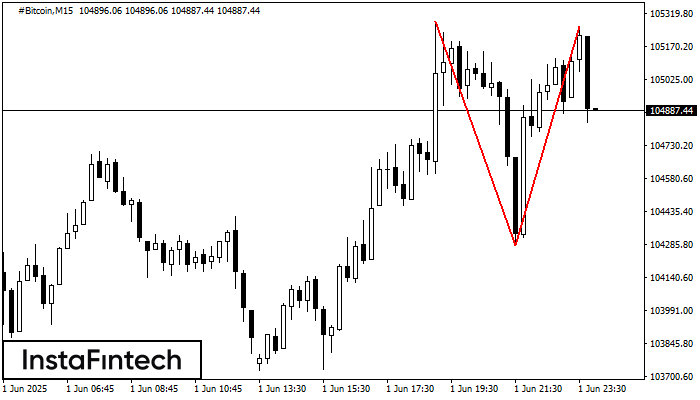
En el gráfico de #Bitcoin M15 el patrón de reversión Doble Techo ha sido formado. Características: límite superior 105260.12; límite inferior 104281.85; el ancho del patrón 97827 puntos. La señal
Los marcos de tiempo M5 y M15 pueden tener más puntos de entrada falsos.
Open chart in a new window


