

Padrões atuais

Padrões são modelos gráficos que são formados no gráfico pelo preço. Segundo um dos postulados da análise técnica, a história (movimento de preços) se repete. Isso significa que os movimentos de preços geralmente são semelhantes nas mesmas situações, o que possibilita prever o desenvolvimento futuro da situação com alta probabilidade.
Os padrões relevantes da InstaTrade são um serviço fácil de usar, que permite que você esteja ciente das últimas mudanças no mercado e reaja a indícios do mercado a tempo. Em nosso serviço, você sempre encontrará os padrões mais recentes e relevantes em qualquer par e em qualquer período gráfico.
Bearish Symmetrical Triangle
was formed on 22.04 at 00:27:05 (UTC+0)
signal strength 3 of 5

According to the chart of M30, USDJPY formed the Bearish Symmetrical Triangle pattern. This pattern signals a further downward trend in case the lower border 140.49 is breached. Here, a hypothetical profit will equal the width of the available pattern that is -61 pips.
Veja também
- All
- All
- Bearish Rectangle
- Bearish Symmetrical Triangle
- Bearish Symmetrical Triangle
- Bullish Rectangle
- Double Top
- Double Top
- Triple Bottom
- Triple Bottom
- Triple Top
- Triple Top
- All
- All
- Buy
- Sale
- All
- 1
- 2
- 3
- 4
- 5
Fundo triplo
was formed on 09.06 at 11:01:02 (UTC+0)
signal strength 3 of 5
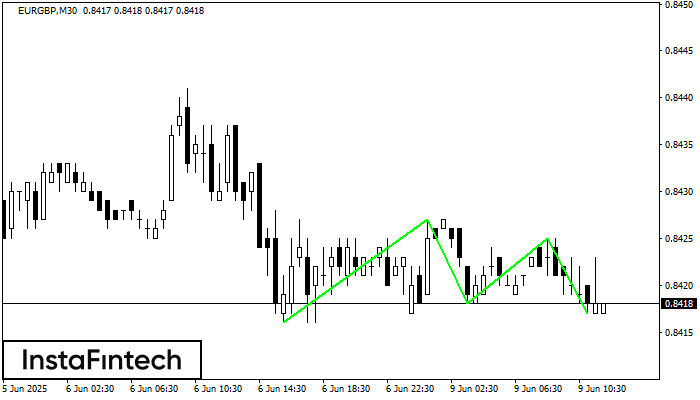
O padrão Fundo triplo foi formado no gráfico do instrumento de negociação EURGBP M30. O padrão sinaliza uma mudança na tendência de baixa para alta no caso de quebra
Open chart in a new window
Retângulo de alta
was formed on 09.06 at 10:10:49 (UTC+0)
signal strength 1 of 5
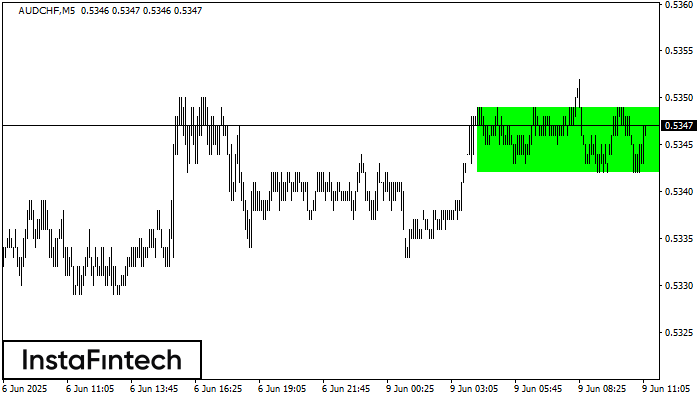
De acordo com o gráfico de M5, AUDCHF formou Retângulo de alta. O padrão indica uma continuação da tendência. O limite superior é 0.5349, o limite inferior é 0.5342
Os intervalos M5 e M15 podem ter mais pontos de entrada falsos.
Open chart in a new window
Bandeira de Baixa
was formed on 09.06 at 10:03:57 (UTC+0)
signal strength 1 of 5
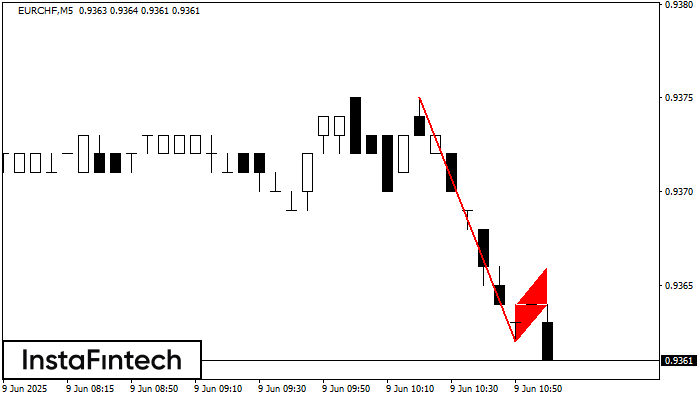
O padrão Bandeira de Baixa foi formado no gráfico EURCHF M5. Portanto, é provável que a tendência de queda continue a curto prazo. Assim que o preço cair abaixo
Os intervalos M5 e M15 podem ter mais pontos de entrada falsos.
Open chart in a new window


