

Padrões atuais

Padrões são modelos gráficos que são formados no gráfico pelo preço. Segundo um dos postulados da análise técnica, a história (movimento de preços) se repete. Isso significa que os movimentos de preços geralmente são semelhantes nas mesmas situações, o que possibilita prever o desenvolvimento futuro da situação com alta probabilidade.
Os padrões relevantes da InstaTrade são um serviço fácil de usar, que permite que você esteja ciente das últimas mudanças no mercado e reaja a indícios do mercado a tempo. Em nosso serviço, você sempre encontrará os padrões mais recentes e relevantes em qualquer par e em qualquer período gráfico.
Triple Bottom
was formed on 18.04 at 20:00:39 (UTC+0)
signal strength 2 of 5

The Triple Bottom pattern has formed on the chart of AUDCAD M15. Features of the pattern: The lower line of the pattern has coordinates 0.8845 with the upper limit 0.8845/0.8836, the projection of the width is 26 points. The formation of the Triple Bottom pattern most likely indicates a change in the trend from downward to upward. This means that in the event of a breakdown of the resistance level 0.8819, the price is most likely to continue the upward movement.
The M5 and M15 time frames may have more false entry points.
Veja também
- All
- All
- Bearish Rectangle
- Bearish Symmetrical Triangle
- Bearish Symmetrical Triangle
- Bullish Rectangle
- Double Top
- Double Top
- Triple Bottom
- Triple Bottom
- Triple Top
- Triple Top
- All
- All
- Buy
- Sale
- All
- 1
- 2
- 3
- 4
- 5
डबल टॉप
was formed on 30.04 at 23:00:21 (UTC+0)
signal strength 5 of 5

NZDCAD D1 के चार्ट पर डबल टॉप रीवर्सल पैटर्न बना है। विशेषताएं: ऊपरी सीमा 0.8316; निचली सीमा 0.7826; पैटर्न की चौड़ाई 490 पॉइंट्स। संकेत: निचली सीमा के टूटने से 0.7786
Open chart in a new window
ट्रिपल बॉटम
was formed on 30.04 at 22:40:20 (UTC+0)
signal strength 1 of 5
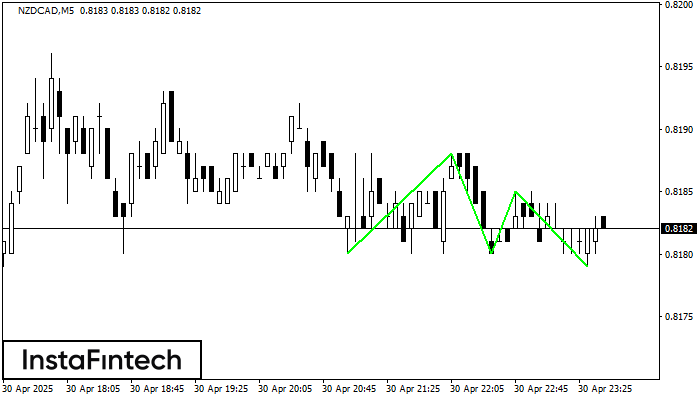
ट्रिपल बॉटम पैटर्न NZDCAD M5 पर बना है। इसकी निम्नलिखित विशेषताएं हैं: प्रतिरोध स्तर 0.8188/0.8185; समर्थन स्तर 0.8180/0.8179; चौड़ाई 8 पॉइंट्स है। 0.8188 के प्रतिरोध स्तर के टूटने की स्थिति
M5 और M15 समय सीमा में अधिक फाल्स एंट्री पॉइंट्स हो सकते हैं।
Open chart in a new window
बुलिश सिमेट्रिकल त्रिभुज
was formed on 30.04 at 21:56:12 (UTC+0)
signal strength 2 of 5

M15 के चार्ट के अनुसार, #Bitcoin से बुलिश सिमेट्रिकल त्रिभुज पैटर्न बना। पैटर्न की निचली सीमा ने निर्देशांक 92482.78/94081.93 को स्पर्श किया जबकि ऊपरी सीमा 95186.64/94081.93 के पार गई। यदि
M5 और M15 समय सीमा में अधिक फाल्स एंट्री पॉइंट्स हो सकते हैं।
Open chart in a new window


