

Padrões atuais

Padrões são modelos gráficos que são formados no gráfico pelo preço. Segundo um dos postulados da análise técnica, a história (movimento de preços) se repete. Isso significa que os movimentos de preços geralmente são semelhantes nas mesmas situações, o que possibilita prever o desenvolvimento futuro da situação com alta probabilidade.
Os padrões relevantes da InstaTrade são um serviço fácil de usar, que permite que você esteja ciente das últimas mudanças no mercado e reaja a indícios do mercado a tempo. Em nosso serviço, você sempre encontrará os padrões mais recentes e relevantes em qualquer par e em qualquer período gráfico.
Triple Top
was formed on 18.04 at 18:00:33 (UTC+0)
signal strength 3 of 5
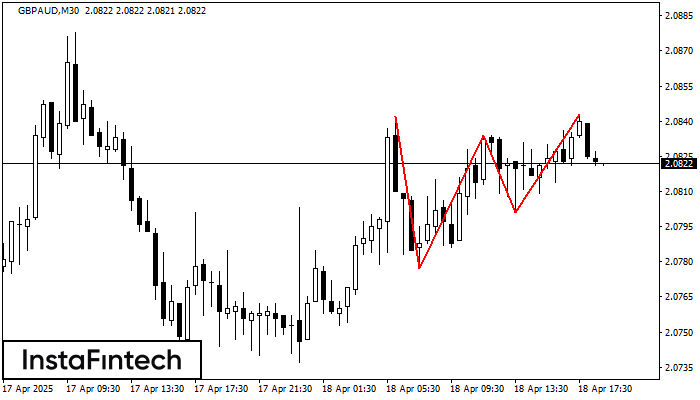
The Triple Top pattern has formed on the chart of the GBPAUD M30. Features of the pattern: borders have an ascending angle; the lower line of the pattern has the coordinates 2.0777/2.0801 with the upper limit 2.0842/2.0843; the projection of the width is 65 points. The formation of the Triple Top figure most likely indicates a change in the trend from upward to downward. This means that in the event of a breakdown of the support level of 2.0777, the price is most likely to continue the downward movement.
- All
- All
- Bearish Rectangle
- Bearish Symmetrical Triangle
- Bearish Symmetrical Triangle
- Bullish Rectangle
- Double Top
- Double Top
- Triple Bottom
- Triple Bottom
- Triple Top
- Triple Top
- All
- All
- Buy
- Sale
- All
- 1
- 2
- 3
- 4
- 5
Double Bottom
was formed on 10.06 at 05:15:46 (UTC+0)
signal strength 1 of 5
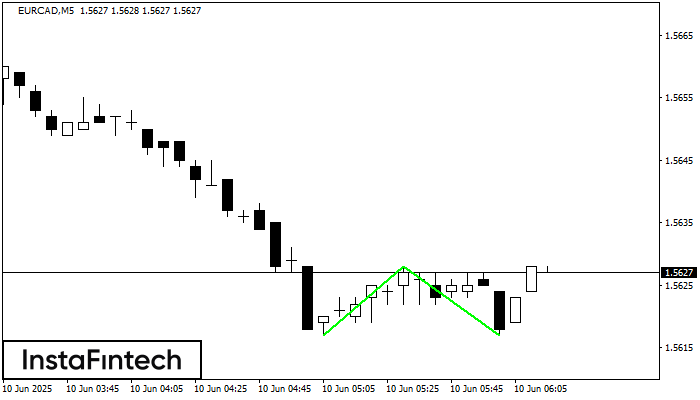
The Double Bottom pattern has been formed on EURCAD M5. Characteristics: the support level 1.5617; the resistance level 1.5628; the width of the pattern 11 points. If the resistance level
The M5 and M15 time frames may have more false entry points.
Open chart in a new window
Triple Top
was formed on 10.06 at 04:45:52 (UTC+0)
signal strength 2 of 5
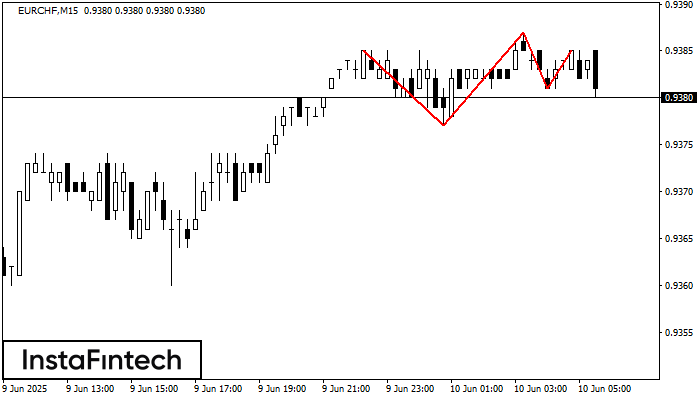
The Triple Top pattern has formed on the chart of the EURCHF M15 trading instrument. It is a reversal pattern featuring the following characteristics: resistance level 0, support level -4
The M5 and M15 time frames may have more false entry points.
Open chart in a new window
Double Top
was formed on 10.06 at 04:00:36 (UTC+0)
signal strength 4 of 5
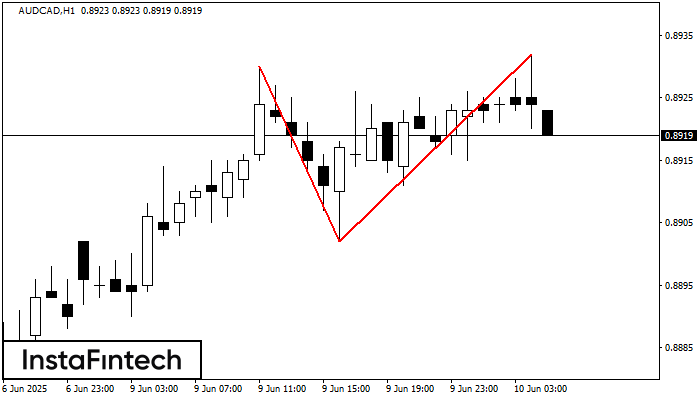
On the chart of AUDCAD H1 the Double Top reversal pattern has been formed. Characteristics: the upper boundary 0.8932; the lower boundary 0.8902; the width of the pattern 30 points
Open chart in a new window


