

Padrões atuais

Padrões são modelos gráficos que são formados no gráfico pelo preço. Segundo um dos postulados da análise técnica, a história (movimento de preços) se repete. Isso significa que os movimentos de preços geralmente são semelhantes nas mesmas situações, o que possibilita prever o desenvolvimento futuro da situação com alta probabilidade.
Os padrões relevantes da InstaTrade são um serviço fácil de usar, que permite que você esteja ciente das últimas mudanças no mercado e reaja a indícios do mercado a tempo. Em nosso serviço, você sempre encontrará os padrões mais recentes e relevantes em qualquer par e em qualquer período gráfico.
Double Top
was formed on 18.04 at 04:00:48 (UTC+0)
signal strength 3 of 5
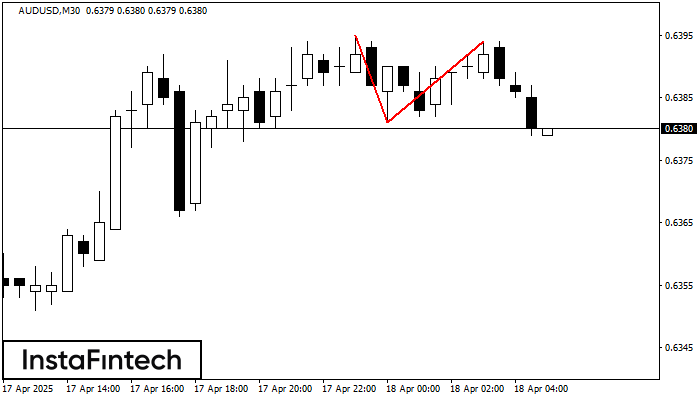
On the chart of AUDUSD M30 the Double Top reversal pattern has been formed. Characteristics: the upper boundary 0.6394; the lower boundary 0.6381; the width of the pattern 13 points. The signal: a break of the lower boundary will cause continuation of the downward trend targeting the 0.6351 level.
- All
- All
- Bearish Rectangle
- Bearish Symmetrical Triangle
- Bearish Symmetrical Triangle
- Bullish Rectangle
- Double Top
- Double Top
- Triple Bottom
- Triple Bottom
- Triple Top
- Triple Top
- All
- All
- Buy
- Sale
- All
- 1
- 2
- 3
- 4
- 5
Cabeça & Ombros
was formed on 13.06 at 20:20:21 (UTC+0)
signal strength 1 of 5
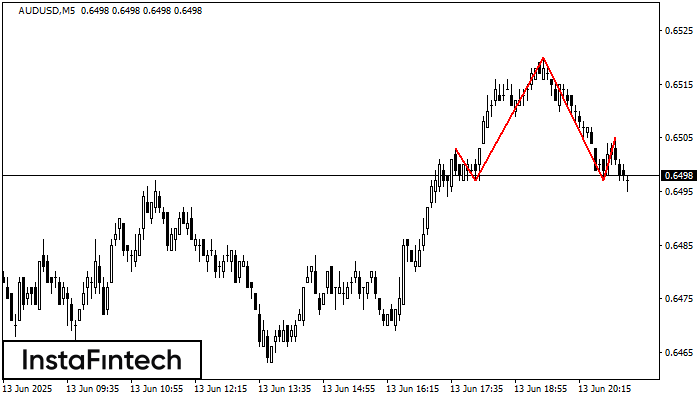
O padrão técnico chamado Cabeça & Ombros apareceu no gráfico de AUDUSD M5. Há razões de peso para sugerir que o preço ultrapassará a Linha do Pescoço 0.6497/0.6497 após
Os intervalos M5 e M15 podem ter mais pontos de entrada falsos.
Open chart in a new window
Cabeça & Ombros
was formed on 13.06 at 20:10:26 (UTC+0)
signal strength 1 of 5
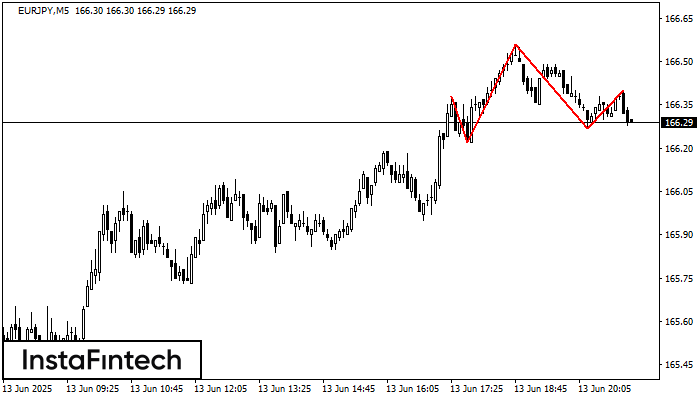
De acordo com o gráfico de M5, EURJPY formou o padrão Cabeça & Ombros. O topo da Cabeça está definido em 166.56 enquanto a linha mediana do Pescoço é encontrada
Os intervalos M5 e M15 podem ter mais pontos de entrada falsos.
Open chart in a new window
Retângulo de baixa
was formed on 13.06 at 19:39:32 (UTC+0)
signal strength 3 of 5
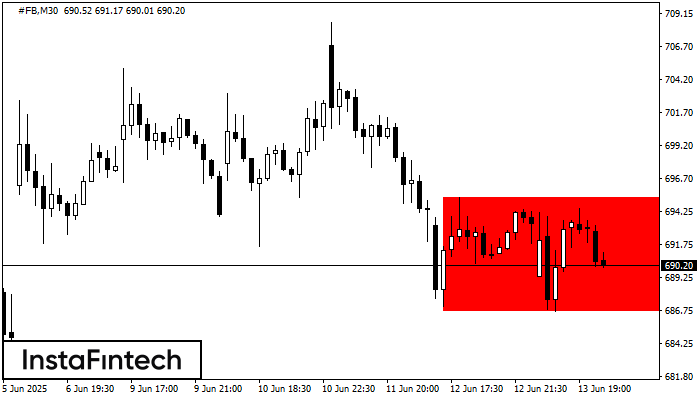
De acordo com o gráfico de M30, #FB formou Retângulo de baixa. Este tipo de padrão indica uma continuação da tendência. Ele consiste em dois níveis: resistência 695.27 – 0.00
Open chart in a new window


