

Padrões atuais

Padrões são modelos gráficos que são formados no gráfico pelo preço. Segundo um dos postulados da análise técnica, a história (movimento de preços) se repete. Isso significa que os movimentos de preços geralmente são semelhantes nas mesmas situações, o que possibilita prever o desenvolvimento futuro da situação com alta probabilidade.
Os padrões relevantes da InstaTrade são um serviço fácil de usar, que permite que você esteja ciente das últimas mudanças no mercado e reaja a indícios do mercado a tempo. Em nosso serviço, você sempre encontrará os padrões mais recentes e relevantes em qualquer par e em qualquer período gráfico.
Bearish Symmetrical Triangle
was formed on 15.04 at 01:05:33 (UTC+0)
signal strength 3 of 5
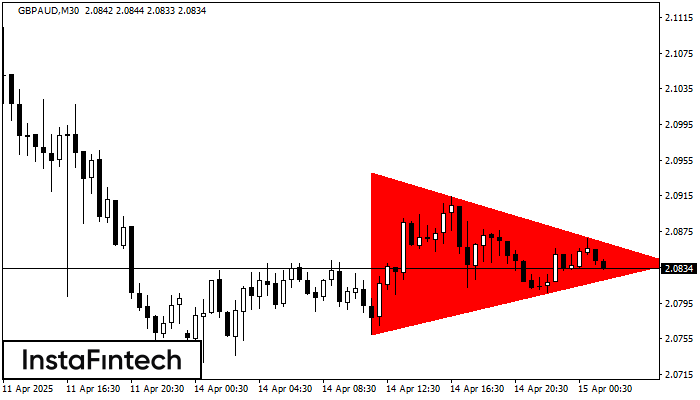
According to the chart of M30, GBPAUD formed the Bearish Symmetrical Triangle pattern. This pattern signals a further downward trend in case the lower border 2.0760 is breached. Here, a hypothetical profit will equal the width of the available pattern that is -182 pips.
- All
- All
- Bearish Rectangle
- Bearish Symmetrical Triangle
- Bearish Symmetrical Triangle
- Bullish Rectangle
- Double Top
- Double Top
- Triple Bottom
- Triple Bottom
- Triple Top
- Triple Top
- All
- All
- Buy
- Sale
- All
- 1
- 2
- 3
- 4
- 5
Retângulo de baixa
was formed on 18.04 at 13:00:27 (UTC+0)
signal strength 3 of 5

De acordo com o gráfico de M30, EURGBP formou Retângulo de baixa. Este tipo de padrão indica uma continuação da tendência. Ele consiste em dois níveis: resistência 0.8574 – 0.0000
Open chart in a new window
Fundo triplo
was formed on 18.04 at 11:50:33 (UTC+0)
signal strength 1 of 5

O padrão Fundo triplo foi formado no gráfico do instrumento de negociação NZDCAD M5. O padrão sinaliza uma mudança na tendência de baixa para alta no caso de quebra
Os intervalos M5 e M15 podem ter mais pontos de entrada falsos.
Open chart in a new window
Fundo triplo
was formed on 18.04 at 11:45:33 (UTC+0)
signal strength 2 of 5

O padrão Fundo triplo foi formado em NZDJPY M15. Possui as seguintes características: nível de resistência 84.49/84.47; nível de suporte 84.31/84.32; a largura é de 18 pontos. Se houver
Os intervalos M5 e M15 podem ter mais pontos de entrada falsos.
Open chart in a new window


