

Padrões atuais

Padrões são modelos gráficos que são formados no gráfico pelo preço. Segundo um dos postulados da análise técnica, a história (movimento de preços) se repete. Isso significa que os movimentos de preços geralmente são semelhantes nas mesmas situações, o que possibilita prever o desenvolvimento futuro da situação com alta probabilidade.
Os padrões relevantes da InstaTrade são um serviço fácil de usar, que permite que você esteja ciente das últimas mudanças no mercado e reaja a indícios do mercado a tempo. Em nosso serviço, você sempre encontrará os padrões mais recentes e relevantes em qualquer par e em qualquer período gráfico.
Triple Bottom
was formed on 24.03 at 20:40:17 (UTC+0)
signal strength 1 of 5
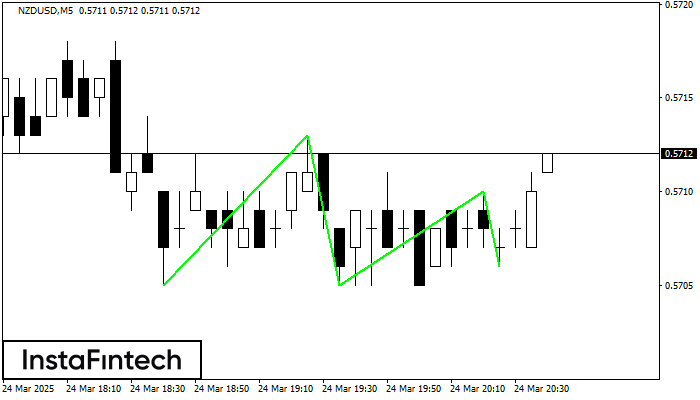
The Triple Bottom pattern has formed on the chart of the NZDUSD M5 trading instrument. The pattern signals a change in the trend from downwards to upwards in the case of breakdown of 0.5713/0.5710.
The M5 and M15 time frames may have more false entry points.
Veja também
- All
- All
- Bearish Rectangle
- Bearish Symmetrical Triangle
- Bearish Symmetrical Triangle
- Bullish Rectangle
- Double Top
- Double Top
- Triple Bottom
- Triple Bottom
- Triple Top
- Triple Top
- All
- All
- Buy
- Sale
- All
- 1
- 2
- 3
- 4
- 5
Retângulo de baixa
was formed on 30.04 at 23:45:43 (UTC+0)
signal strength 1 of 5
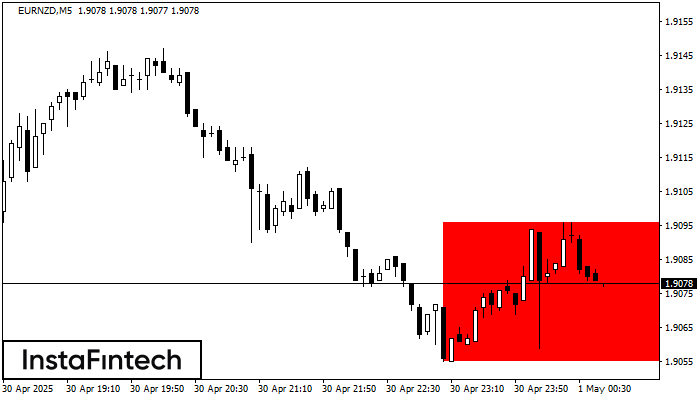
De acordo com o gráfico de M5, EURNZD formou Retângulo de baixa. Este tipo de padrão indica uma continuação da tendência. Ele consiste em dois níveis: resistência 1.9096 – 0.0000
Os intervalos M5 e M15 podem ter mais pontos de entrada falsos.
Open chart in a new window
Topo duplo
was formed on 30.04 at 23:00:21 (UTC+0)
signal strength 5 of 5

No gráfico de NZDCAD D1 o padrão de reversão Topo duplo foi formado. Características: o limite superior 0.8316; o limite inferior 0.7826; a largura do padrão 490 pontos. O sinal
Open chart in a new window
Fundo triplo
was formed on 30.04 at 22:40:20 (UTC+0)
signal strength 1 of 5
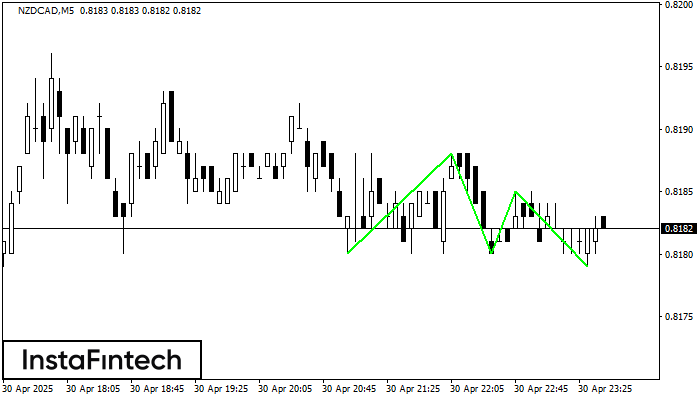
O padrão Fundo triplo foi formado em NZDCAD M5. Possui as seguintes características: nível de resistência 0.8188/0.8185; nível de suporte 0.8180/0.8179; a largura é de 8 pontos. Se houver
Os intervalos M5 e M15 podem ter mais pontos de entrada falsos.
Open chart in a new window


