Veja também


 20.01.2025 01:12 AM
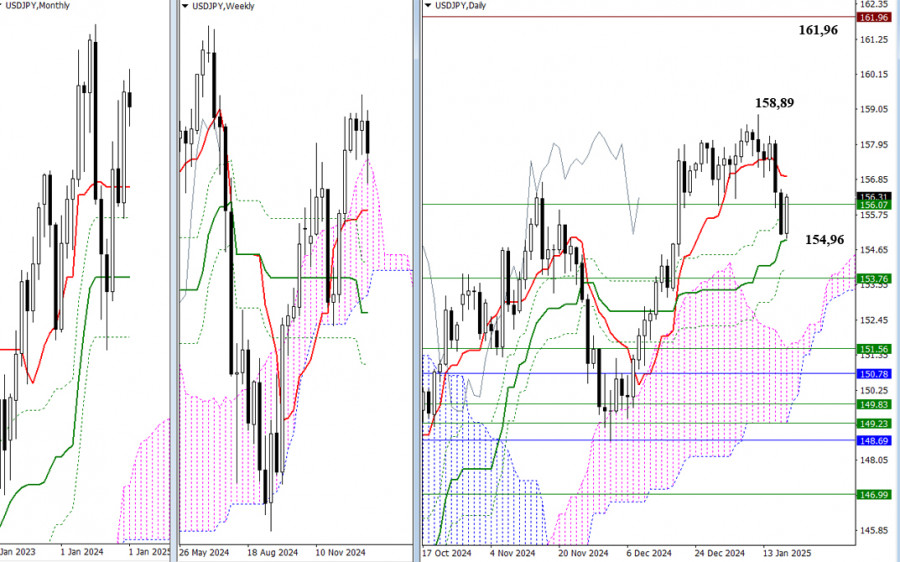
At the end of last week, we observed weekly consolidation, resulting in a long lower shadow reaching into the boundaries of the weekly Ichimoku cloud at 156.07. Sellers may now attempt to maintain the initiative needed to return to and consolidate within the weekly cloud. To do this successfully, they must first overcome the daily Ichimoku cross, which is situated between 154.96 and 154.03, and reclaim the weekly short-term trend at 153.76.
If sellers are unsuccessful and buyers manage to continue recovering their positions, the bulls will aim to regain the daily short-term trend at 156.94 and target a move out of the corrective zone at 158.89, which would allow them to resume the uptrend. Breaking the nearest high at 158.89 will restore the upward trend on both the daily and weekly timeframes. For the price to return to the monthly trend movement, it will need to surpass the monthly high at 161.96.
***
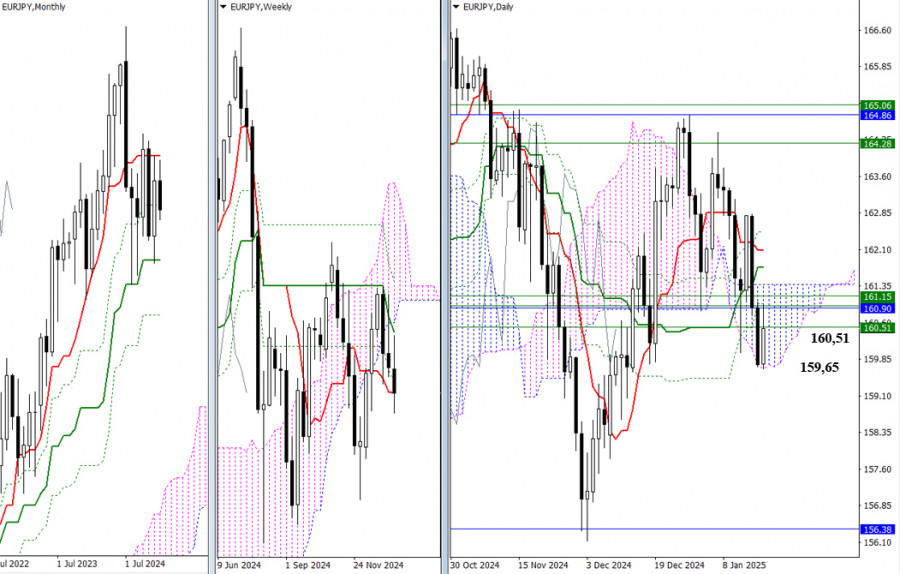
Last week, the EUR/JPY pair experienced a significant struggle. On Monday, buyers attempted to take control and initiate a corrective rally; however, their efforts were unsuccessful. Sellers managed to halt this rally, push the price to new lows, close below a critical support cluster, and reach the lower boundary of the daily Ichimoku cloud at 159.74.
On Friday, buyers launched another attempt, but the support cluster from Monday had transformed into resistance, which slowed the bullish recovery. This resistance zone, now reinforced by the daily Ichimoku cross, has expanded and lies between 160.51 and 162.46, with specific levels at 160.51, 160.90, 161.15, 161.38, 161.73, 162.08, and 162.46.
If buyers can break through this resistance zone, it could trigger a more sustained and significant bullish momentum. Conversely, if sellers maintain their position at these resistance levels, they will aim to push the price below the daily Ichimoku cloud at 159.65, targeting the monthly medium-term trend support at 156.38.
***
You have already liked this post today
*A análise de mercado aqui postada destina-se a aumentar o seu conhecimento, mas não dar instruções para fazer uma negociação.
Com o surgimento de uma divergência entre o movimento de preços do índice Nasdaq 100 — que formou um padrão de topo duplo — e o indicador Oscilador Estocástico, além
Como podemos observar no gráfico de 4 horas do par principal USD/CHF, surgem alguns sinais técnicos interessantes. Em primeiro lugar, nota-se uma divergência entre o movimento do preço
No início da sessão americana, o par EUR/USD está sendo negociado próximo de 1,1327, mostrando uma força de alta que está desaparecendo. Tendo atingido o topo do canal de tendência
Clube InstaForex

Your IP address shows that you are currently located in the USA. If you are a resident of the United States, you are prohibited from using the services of InstaFintech Group including online trading, online transfers, deposit/withdrawal of funds, etc.
If you think you are seeing this message by mistake and your location is not the US, kindly proceed to the website. Otherwise, you must leave the website in order to comply with government restrictions.
Why does your IP address show your location as the USA?
Please confirm whether you are a US resident or not by clicking the relevant button below. If you choose the wrong option, being a US resident, you will not be able to open an account with InstaTrade anyway.
We are sorry for any inconvenience caused by this message.


