Veja também


 26.06.2023 04:01 AM
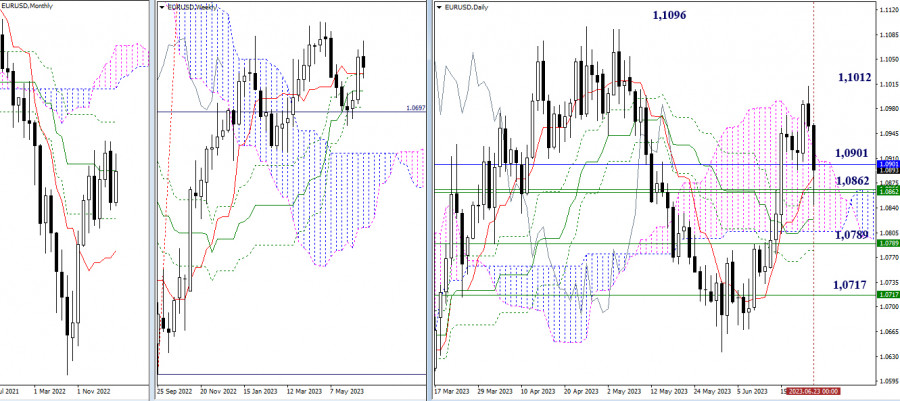
The renewal of last week's highs did not allow the bulls to continue the rally. The situation was hampered by the effective bearish correction. On the last day of the week, the market tested quite a strong support zone (1.0901 - 1.0862), combining many levels from different timeframes. At the end of the meeting a rather long lower shadow was formed on the candlesticks of the daily and weekly charts. This support zone (1.0901 - 1.0862) retained its value. Working above 1.0901, as well as entering the bullish zone relative to the daily cloud (1.0906), will provide a bullish advantage and this will give bulls the hope that they can further recover. The nearest bullish targets will be the maximum extremums (1.1012 - 1.1096). A breakthrough (1.0901 - 1.0862) set the task of breaking out of the daily cloud (1.0806), as well as to eliminate the daily (1.0780) and weekly (1.0789 - 1.0717) Ichimoku golden crosses.
***
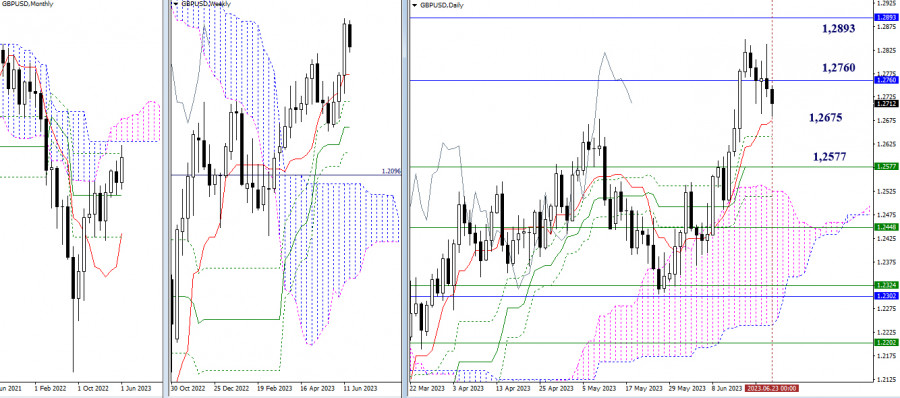
The bears have been busy developing a downward correction. They fell short of testing the daily short-term trend (1.2675). Therefore, the bearish targets remain unchanged and will retain their significance, as they will confront bearish players at the levels of the daily (1.2675) and weekly (1.2577) short-term trends. For bulls, the existing targets also remain unchanged, currently positioned at 1.2760 (the final level of the monthly Ichimoku cross) and 1.2893 (the lower band of the monthly Ichimoku cloud).
***
The technical analysis of the situation used:
high timeframes - Ichimoku Kinko Hyo (9.26.52) + Fibo Kijun levels;
lower timeframes - 1H - Pivot Points (classic) + Moving Average 120 (weekly long-term trend).
You have already liked this post today
*A análise de mercado aqui postada destina-se a aumentar o seu conhecimento, mas não dar instruções para fazer uma negociação.
No início da sessão americana, o par EUR/USD está sendo negociado próximo de 1,1327, mostrando uma força de alta que está desaparecendo. Tendo atingido o topo do canal de tendência
No início da sessão americana, o ouro está sendo negociado em torno de 3.304, acima do nível Murray de 6/8, e dentro do canal de tendência de alta formado
Embora no gráfico de 4 horas o par AUD/JPY esteja mostrando sinais de enfraquecimento, tudo indica que esse movimento representa apenas uma correção momentânea. Desde que o preço não rompa
No gráfico de 4 horas, a Prata apresenta sinais de convergência entre o movimento de preço e o indicador Oscilador Estocástico, o que sugere um potencial de fortalecimento no curto
 Our new app for your convenient and fast verification
Clube InstaForex

Your IP address shows that you are currently located in the USA. If you are a resident of the United States, you are prohibited from using the services of InstaFintech Group including online trading, online transfers, deposit/withdrawal of funds, etc.
If you think you are seeing this message by mistake and your location is not the US, kindly proceed to the website. Otherwise, you must leave the website in order to comply with government restrictions.
Why does your IP address show your location as the USA?
Please confirm whether you are a US resident or not by clicking the relevant button below. If you choose the wrong option, being a US resident, you will not be able to open an account with InstaTrade anyway.
We are sorry for any inconvenience caused by this message.


