Veja também


 11.07.2023 12:05 AM
Overview :
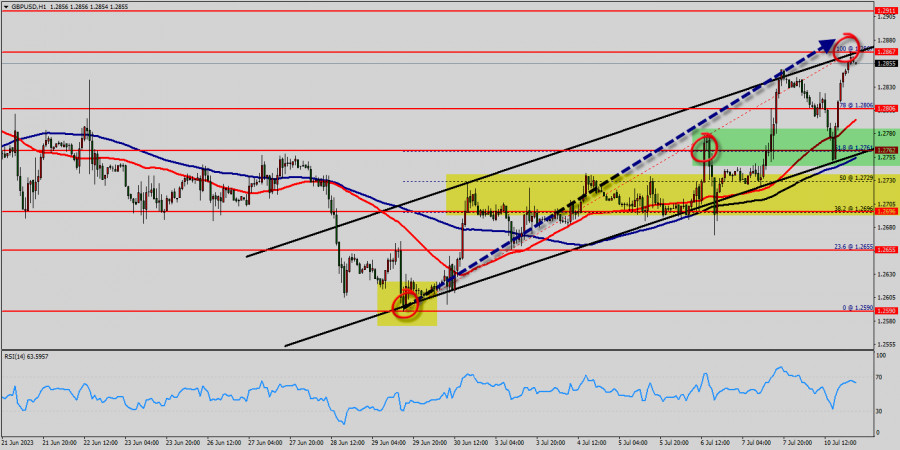
The GBP/USD pair rises to highest levels above 1.2761. The GBP/USD pair surpassed 1.28060 during the American session, reaching the highest level in more than a year, boosted by a weaker US Dollar. An improvement in risk sentiment weighed on the Greenback. The UK's ONS will release labor market data on Monday.
The Relative Strength Index (RSI) indicator on the four-hour chart stays near 70 early Monday, highlighting a lack of seller interest. On the upside, 1.2806 (multi-month high, static level, mid-point of long-term ascending regression channel) aligns as first resistance ahead of 1.2806 (psychological level) and 1.2867 (upper-limit of the ascending channel).
Uptrend :
The GBP/USD pair rose from the level of 1.2806 towards 1.2867 yesterday. Now, the current price is set around the area of 1.2867. On the H1 chart, the resistance is seen at the levels of 1.2867 and 1.1911. Besides, the weekly support 1 is seen at the level of 1.2762.
The Pound is at an all-time high against the dollar around the spot of 1.2761 - 1.2867 - Ethereum is inside in upward channel. Closing above the major support (1.2761) could assure that GBP/USD will move higher towards cooling new highs. The trend is continuing rising by market cap at 2.3% in a day, 16.1% in a week, and 64.4% in a month, and is trading at 1.2806 after it reached 1.2867 earlier.
The ternd has been set above the strong support at the price of 1.2761, which coincides with the 61.8% Fibonacci retracement level. This support has been rejected three times confirming the veracity of an uptrend. The market is likely to show signs of a bullish trend around the spot of 1.2761.
Today, the GBP/USD pair is continuing to move in a bullish trend from the new support level of 1.2762, to form a bullish channel. Amid the previous events, we expect the pair to move between 1.2762 and 1.1911. The bulls must break through 1.2867 in order to resume the up trend.
Buy orders are recommended above the area of 1.2806 with the first target at the price of 1.2911; and continue towards 1.2950 in order to test the last bullish wave. On the other hand , if the GBP/USD pair fails to break through the resistance price of 1.2867 today, the market will decline further to 1.2696.
On contrast; in case a reversal takes place and the GBP/USD pair breaks through the support level of 1.2762/1.2703, a further decline to 0.6561 can occur which would indicate a bearish market. On the downside, the 1.2762 level represents support. The next major support is located near the 1.2703, which the price may drift below towards the 1.2590 support region.
| R2 | 1.2911 | |
| R1 | 1.2867 | |
| Pivot point | 1.2761 | |
| S1 | 1.2996 | |
| S2 | 1.2590 |
You have already liked this post today
*A análise de mercado aqui postada destina-se a aumentar o seu conhecimento, mas não dar instruções para fazer uma negociação.
Ao analisarmos o gráfico de 4 horas do par cruzado GBP/CHF, observamos diversos elementos interessantes. Primeiramente, o surgimento de um padrão de triângulo, aliado ao movimento
Com o par AUD/CAD se movendo acima da média móvel ponderada de 21 períodos (WMA 21), que apresenta inclinação positiva, e com a ocorrência de convergência entre o movimento
Com base na análise do gráfico de 4 horas do índice Nasdaq 100, destacam-se três pontos principais: primeiro, o movimento dos preços ocorre abaixo da média móvel de 100 períodos
Os preços do ouro continuam sustentados pela névoa de incertezas que cerca o desdobramento das guerras tarifárias iniciadas por Donald Trump. O metal precioso vem apresentando uma valorização quase vertical
O indicador Eagle está atingindo uma sobrecompra extrema. Portanto, nos níveis de preço atuais, abaixo de sua maior alta de todos os tempos, será possível vender visando chegar a 3.281
Notificações por
E-mail/SMS

Your IP address shows that you are currently located in the USA. If you are a resident of the United States, you are prohibited from using the services of InstaFintech Group including online trading, online transfers, deposit/withdrawal of funds, etc.
If you think you are seeing this message by mistake and your location is not the US, kindly proceed to the website. Otherwise, you must leave the website in order to comply with government restrictions.
Why does your IP address show your location as the USA?
Please confirm whether you are a US resident or not by clicking the relevant button below. If you choose the wrong option, being a US resident, you will not be able to open an account with InstaTrade anyway.
We are sorry for any inconvenience caused by this message.

