Veja também


 31.03.2023 06:09 PM
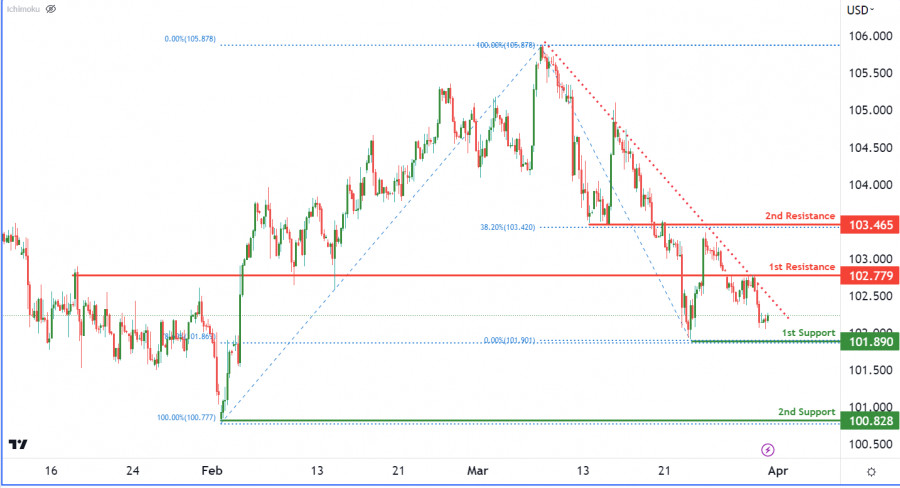
O gráfico DXY mostra uma dinâmica de baixa, com preços abaixo de uma significativa linha de tendência descendente. O primeiro nível de suporte em 101,89, um suporte baixo oscilante, coincide com um nível de retração Fibonacci de 78,60%, tornando-o um nível forte a ser observado. O segundo nível de suporte a 100,82 é também um suporte baixo oscilante. Enquanto isso, o primeiro nível de resistência a 102,77, uma resistência de sobreposição, pode funcionar como um nível forte a ser observado se os preços subirem. A quebra deste nível pode levar a um aumento em direção ao segundo nível de resistência a 103,46, uma resistência de sobreposição que coincide com um nível de retração Fibonacci de 38,20%.
You have already liked this post today
*A análise de mercado aqui postada destina-se a aumentar o seu conhecimento, mas não dar instruções para fazer uma negociação.
Gráfico de Forex
Versão-Web

Your IP address shows that you are currently located in the USA. If you are a resident of the United States, you are prohibited from using the services of InstaFintech Group including online trading, online transfers, deposit/withdrawal of funds, etc.
If you think you are seeing this message by mistake and your location is not the US, kindly proceed to the website. Otherwise, you must leave the website in order to comply with government restrictions.
Why does your IP address show your location as the USA?
Please confirm whether you are a US resident or not by clicking the relevant button below. If you choose the wrong option, being a US resident, you will not be able to open an account with InstaTrade anyway.
We are sorry for any inconvenience caused by this message.

