یہ بھی دیکھیں


 10.06.2022 11:14 AM
Hi everyone!
Traditionally, I make an analysis of the euro/pound par on Friday. In today's two previous articles on the euro/dollar and pound/dollar pairs, I analyzed the results of yesterday's ECB meeting, the market reaction, and the main risks for the UK economy. For this reason, in this article, I will focus mainly on the technical analysis of EUR/GBP. Let's look at the weekly chart.
Weekly
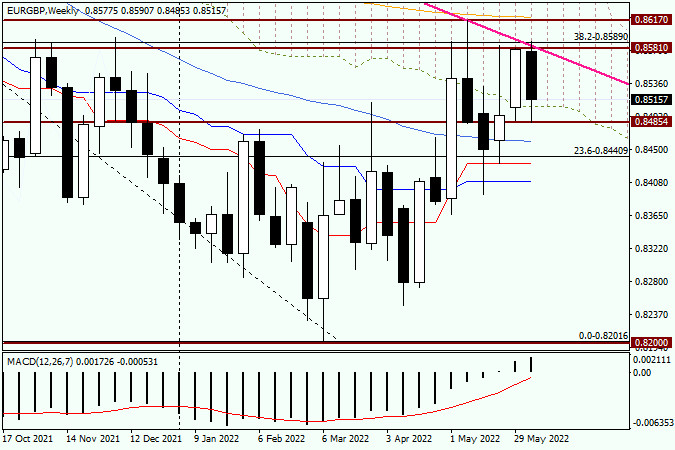
Despite the fact that the euro/pound finished last week near the Ichimoku Cloud, the bears were not ready to give up. As seen on the chart, the pair has been trading in a bearish channel during this week. Sellers have even tried to push the price below the Ichimoku Cloud. Thus, they will do everything possible to end the week near the cloud. Some sellers will try to complete the week near the indicator, while others, on the contrary, will try to push the price down. Judging by technical indicators, there is a strong resistance area of 0.8581-0.8617. At the first level, the highest level of last week was located. The bulls' attempts to break through the resistance level of 0.8581 only led to a false breakout.
The support level indicates last week's lows as trading was carried out at 0.8487. The attempts of bears to push the pair below this level were also unsuccessful. Given the technical outlook on the weekly chart, the bullish trend is possible only after a breakout of the resistance level of 0.8617 and the 200 exponential moving average, which is located at this level. Bears have a more difficult task. They need to push the price to all previously passed indicators: 50 moving average, the Tenkan, and Kijun lines. Currently, the pair is n the correction phase. After a decline to 0.9216-0.8201, the pair retreated to the Fibonacci level of 38.2 which shows a bearish trend. Thus, the EUR/GBP pair is in a downtrend channel. It is also confirmed by the pink resistance line. Attempts to break through this line were also unsuccessful.
Daily
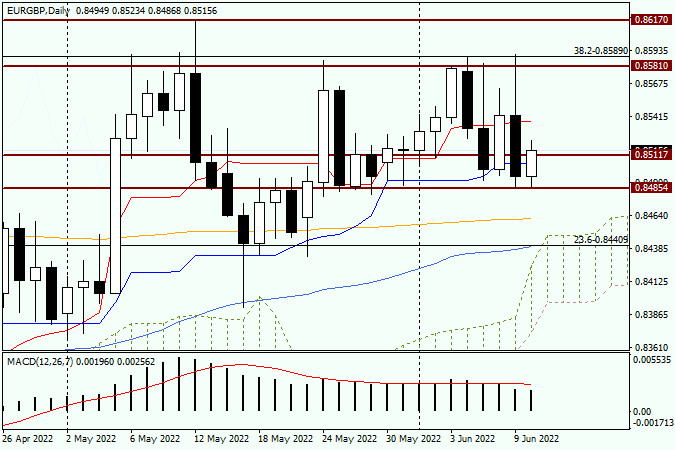
Yesterday's daily candlestick is very similar to the one that was formed for the EUR/GBP pair. After a rise to 0.8590, there was a sharp downward reversal to 0.8485. Apparently, this is a strong technical level as it has stopped yesterday's fall but also facilitated today's growth. If the euro/pound pair continues to rise, it will face resistance near the Tenkan red line, which runs at 0.8538. The pair is trading near 0.8517. Bulls and bears are likely to tussle for the closing price of the day and week near the psychologically important level of 0.8500. Given trader's disappointment with the ECB's rhetoric, as well as yesterday's bearish candlestick with a long upper shadow, the likelihood of a decline is high. It is better to wait for the convergence with the Tenkan line. After that, I would advise you to monitor bearish candlestick patterns on the weekly or smaller charts. If they appear, it will be a sell signal.
Have a wonderful weekend!
You have already liked this post today
*تعینات کیا مراد ہے مارکیٹ کے تجزیات یہاں ارسال کیے جاتے ہیں جس کا مقصد آپ کی بیداری بڑھانا ہے، لیکن تجارت کرنے کے لئے ہدایات دینا نہیں.
آنے والے گھنٹوں کے لیے ہمارا تجارتی منصوبہ 1.1370 اور 1.1230 پر اہداف کے ساتھ 1.1410 سے نیچے فروخت کرنا ہے۔ ایگل انڈیکیٹر منفی سگنل دے رہا ہے،
ایگل انڈیکیٹر اوور سولڈ اشارے دکھا رہا ہے، لیکن ابھی بھی مزید کمی کا امکان موجود ہے، اس لیے کسی بھی تکنیکی ریباؤنڈ کو فروخت کرنے کے سگنل
ایگل انڈیکیٹر اوور سولڈ اشارے دکھا رہا ہے، اس لیے ہمیں یقین ہے کہ سونا تکنیکی اصلاح کے بعد مختصر مدت میں اپنا تیزی کا چکر دوبارہ شروع کر سکتا
آنے والے گھنٹوں کے لیے ہمارا ٹریڈنگ پلان یہ ہے کہ یورو کے 1.1429 یا 1.1435 کی مزاحمتی سطحوں تک بحال ہونے کا انتظار کیا جائے تاکہ وہاں سے فروخت
انسٹا فاریکس کلب

Your IP address shows that you are currently located in the USA. If you are a resident of the United States, you are prohibited from using the services of InstaFintech Group including online trading, online transfers, deposit/withdrawal of funds, etc.
If you think you are seeing this message by mistake and your location is not the US, kindly proceed to the website. Otherwise, you must leave the website in order to comply with government restrictions.
Why does your IP address show your location as the USA?
Please confirm whether you are a US resident or not by clicking the relevant button below. If you choose the wrong option, being a US resident, you will not be able to open an account with InstaTrade anyway.
We are sorry for any inconvenience caused by this message.


