

Долзарб паттернлар

Тройная вершина
сформирован 31.03 в 15:15:11 (UTC+0)
сила сигнала 2 из 5

На графике GOLD M15 образовалась фигура «Тройная вершина», которая сигнализирует об изменении тенденции. Возможный сценарий: После формирования третьей вершины котировка постарается пробить нижнюю границу 3112.94, где трейдеру и стоило бы открывать торговую позицию на продажу. Тейк Профит - это и есть проекция ширины фигуры, которая составляет 1032 пунктов.
Таймфреймы М5 и М15 могут иметь больше ложных точек входа.
Шунингдек кўринг
- Все
- Все
- Bearish Rectangle
- Bearish Symmetrical Triangle
- Bearish Symmetrical Triangle
- Bullish Rectangle
- Double Top
- Double Top
- Triple Bottom
- Triple Bottom
- Triple Top
- Triple Top
- Все
- Все
- Покупка
- Продажа
- Все
- 1
- 2
- 3
- 4
- 5
Triple Top
was formed on 18.04 at 17:45:14 (UTC+0)
signal strength 2 of 5
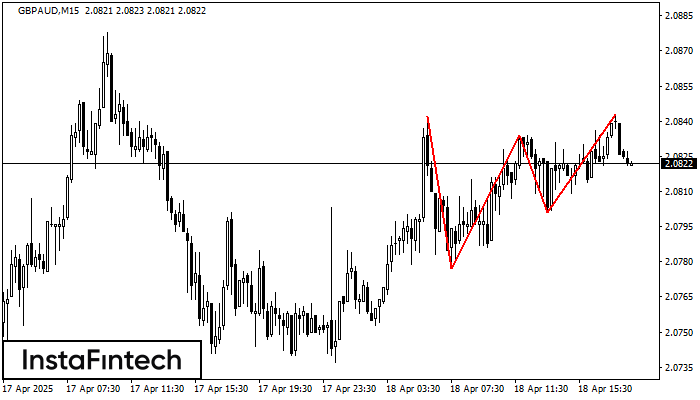
The Triple Top pattern has formed on the chart of the GBPAUD M15 trading instrument. It is a reversal pattern featuring the following characteristics: resistance level -1, support level -24
The M5 and M15 time frames may have more false entry points.
Open chart in a new window
Triple Top
was formed on 18.04 at 17:30:31 (UTC+0)
signal strength 3 of 5
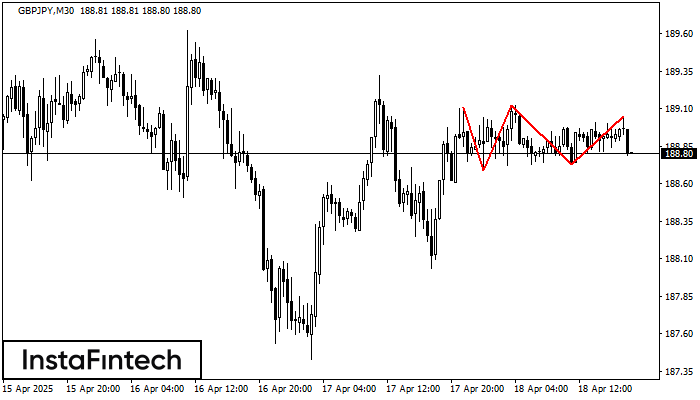
On the chart of the GBPJPY M30 trading instrument, the Triple Top pattern that signals a trend change has formed. It is possible that after formation of the third peak
Open chart in a new window
Triple Bottom
was formed on 18.04 at 16:45:15 (UTC+0)
signal strength 2 of 5
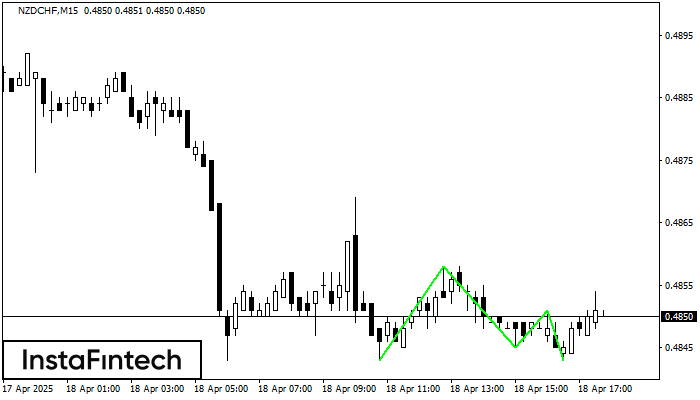
The Triple Bottom pattern has formed on the chart of the NZDCHF M15 trading instrument. The pattern signals a change in the trend from downwards to upwards in the case
The M5 and M15 time frames may have more false entry points.
Open chart in a new window


