
HUFJPY (Hungarian Forint vs Japanese Yen). Exchange rate and online charts.
Currency converter
13 Jun 2025 23:59
(0%)
Closing price, the previous day.
Opening price.
The highest price over the last trading day.
The lowest price over the last trading day
Price range high in the last week
Price range low in the last week
HUF/JPY is not a popular pair on Forex. It represents the cross rate against the U.S. dollar which has a significant influence on it. Thus, combining the USD/JPY and USD/HUF price charts, a trader can get an approximate HUF/JPY price chart.
As the U.S. dollar has a great impact on both currencies, it is necessary to consider the major economic indicators of the USA to predict the future movements of the pair. Such indicators may include the discount rate, GDP growth, unemployment rate, new vacancies, and many others. However, it should be noted that the currencies can respond with different speed to the changes in the U.S. economy, being a specific indicator of HUF/JPY.
The liquidity of this trading instrument is very low as compared to EUR/USD, USD/CHF, GBP/USD, and USD/JPY. Therefore, when you make a projection for this financial instrument, you should primarily focus on USD/JPY and USD/HUF.
HUF/JPY currency pair is very susceptible to a variety of major political and economic changes taking place in the world. Thus, the price chart for this currency pair is poorly predictable and often goes in the opposite direction relatively to any analysis.
It is not recommended for the newbies to start their trading activity on the currency market with HUF/JPY. For successful trading on this financial instrument you need to know a lot of nuances of price chart behavior that can greatly affect the future course rate.
If you trade cross rates, it is necessary to remember that brokers usually set a higher spread for popular currency pairs. Therefore, before you start working with the cross rates, read carefully the terms and conditions offered by the broker.
See Also
- Technical analysis
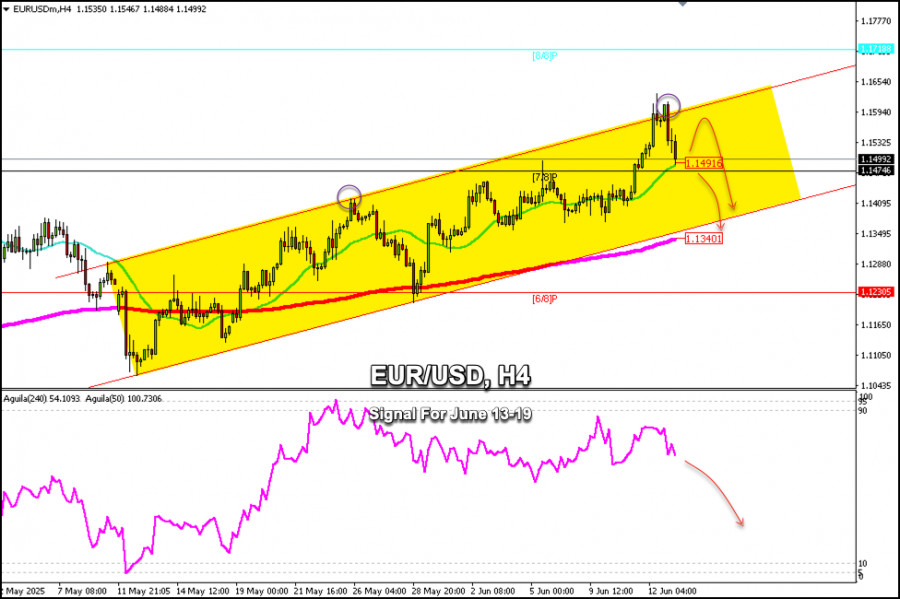
Trading Signals for EUR/USD for June 13-19, 2025: buy above 1.1500 (21 SMA - 7/8 Murray)
Under the opposite scenario, if the euro falls below 1.1490, it is likely to reach the 200 EMA, which is located at 1.1340 and coincides with the bottom of the uptrend channel. This will be seen as a selling opportunity.Author: Dimitrios Zappas
14:14 2025-06-13 UTC+2
3898
Technical analysis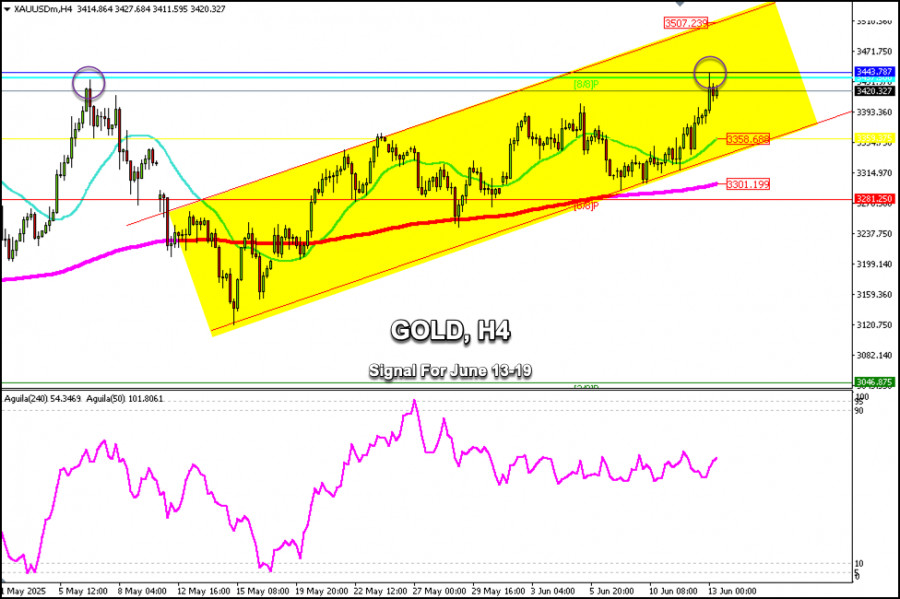
Trading Signals for GOLD for June 13-19, 2025: sell below 3,343 (21 SMA - 8/8 Murray)
Gold has left a gap at 3,282 and another around 3,181. So, if the price falls below the psychological level of 3,300, we could expect it to fall to cover these price levels.Author: Dimitrios Zappas
14:12 2025-06-13 UTC+2
2938
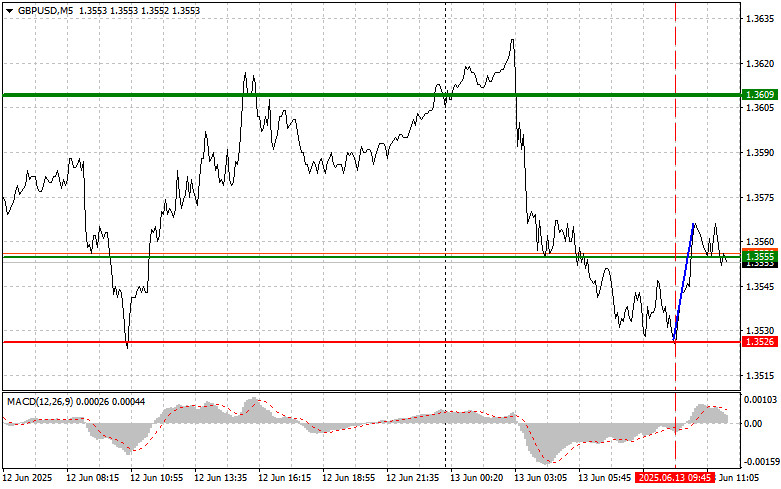
GBP/USD: Simple Trading Tips for Beginner Traders – June 13th (U.S. Session)Author: Jakub Novak
12:44 2025-06-13 UTC+2
2593
- Recovery supported by the U.S. dollar rebound
Author: Irina Yanina
13:09 2025-06-13 UTC+2
2473
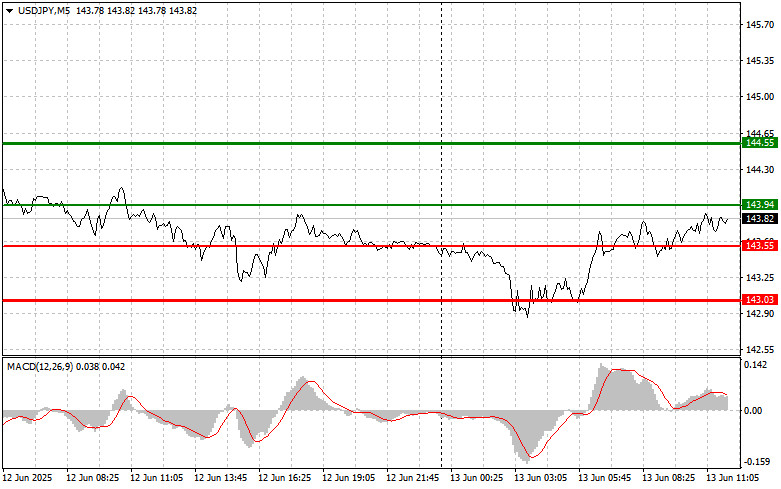
USD/JPY: Simple Trading Tips for Beginner Traders – June 13th (U.S. Session)Author: Jakub Novak
12:49 2025-06-13 UTC+2
2443
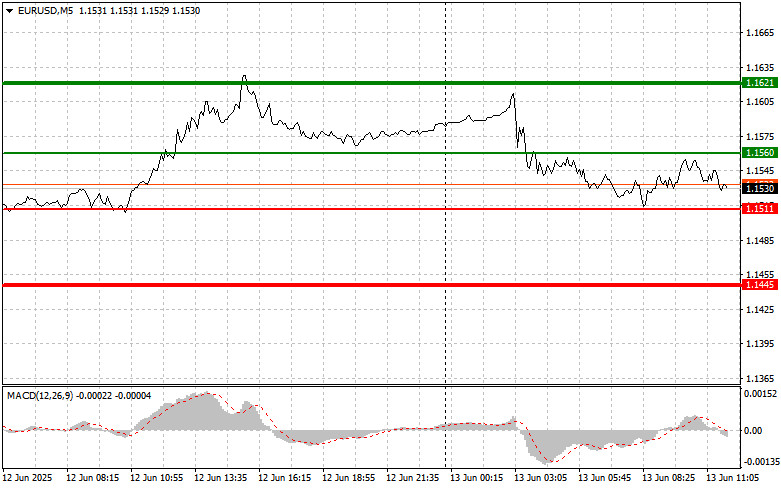
EUR/USD: Simple Trading Tips for Beginner Traders – June 13th (U.S. Session)Author: Jakub Novak
12:41 2025-06-13 UTC+2
2128
- Fundamental analysis
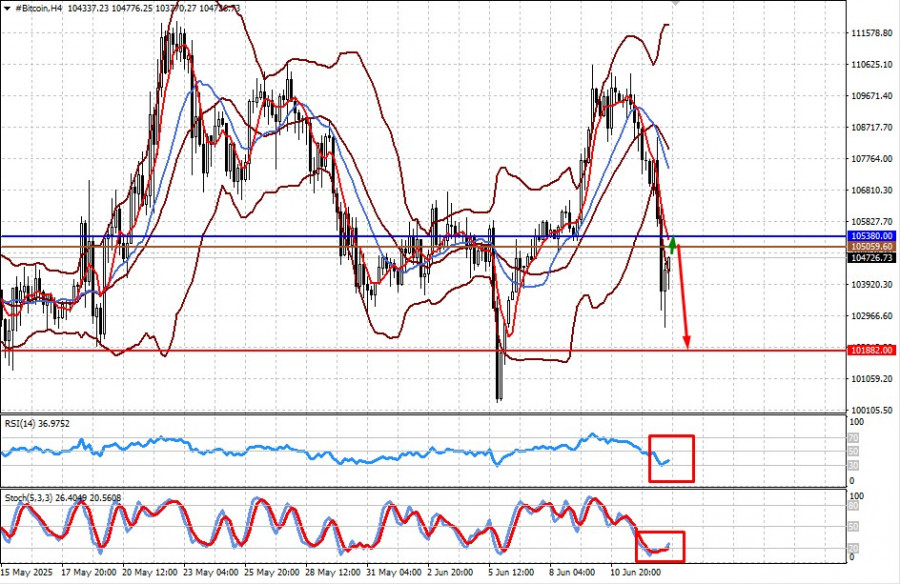
Israeli Missile Strike on Iran Will Crash Global Markets (I Expect Bitcoin and #NDX to Resume Their Decline After a Local Upward Correction)
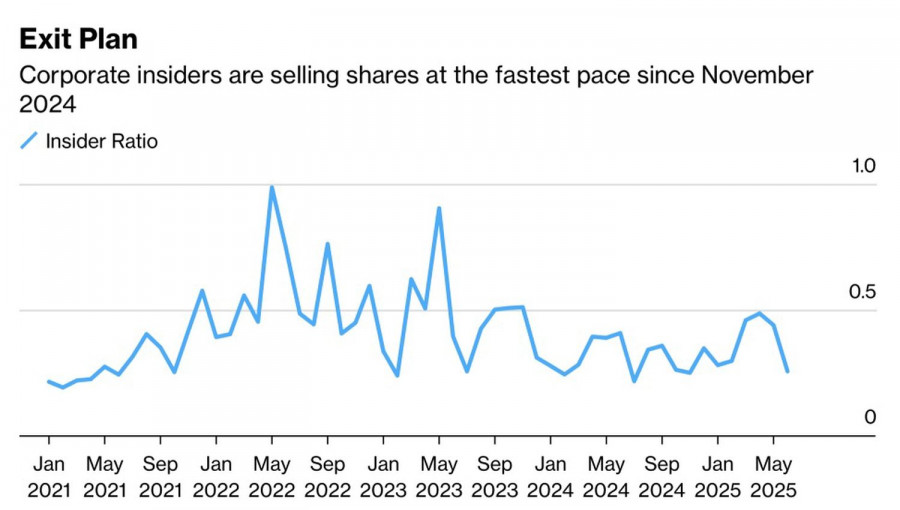
As I anticipated, the lack of a broad positive outcome in negotiations between China and the U.S. and renewed inflationary pressure led to a sharp decline in demand for corporate stocksAuthor: Pati Gani
10:10 2025-06-13 UTC+2
2083
The crowd will be punished for its overconfidence in buying the S&P 500 dipAuthor: Marek Petkovich
09:35 2025-06-13 UTC+2
2008
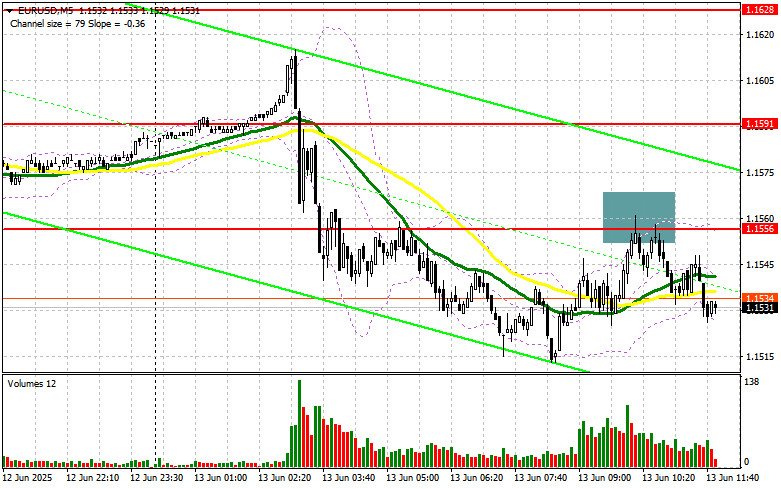
EUR/USD: Trading Plan for the U.S. Session on June 13th (Review of Morning Trades)Author: Miroslaw Bawulski
12:31 2025-06-13 UTC+2
1978

- Technical analysis
Trading Signals for EUR/USD for June 13-19, 2025: buy above 1.1500 (21 SMA - 7/8 Murray)
Under the opposite scenario, if the euro falls below 1.1490, it is likely to reach the 200 EMA, which is located at 1.1340 and coincides with the bottom of the uptrend channel. This will be seen as a selling opportunity.Author: Dimitrios Zappas
14:14 2025-06-13 UTC+2
3898
- Technical analysis
Trading Signals for GOLD for June 13-19, 2025: sell below 3,343 (21 SMA - 8/8 Murray)
Gold has left a gap at 3,282 and another around 3,181. So, if the price falls below the psychological level of 3,300, we could expect it to fall to cover these price levels.Author: Dimitrios Zappas
14:12 2025-06-13 UTC+2
2938
- GBP/USD: Simple Trading Tips for Beginner Traders – June 13th (U.S. Session)
Author: Jakub Novak
12:44 2025-06-13 UTC+2
2593
- Recovery supported by the U.S. dollar rebound
Author: Irina Yanina
13:09 2025-06-13 UTC+2
2473
- USD/JPY: Simple Trading Tips for Beginner Traders – June 13th (U.S. Session)
Author: Jakub Novak
12:49 2025-06-13 UTC+2
2443
- EUR/USD: Simple Trading Tips for Beginner Traders – June 13th (U.S. Session)
Author: Jakub Novak
12:41 2025-06-13 UTC+2
2128
- Fundamental analysis
Israeli Missile Strike on Iran Will Crash Global Markets (I Expect Bitcoin and #NDX to Resume Their Decline After a Local Upward Correction)
As I anticipated, the lack of a broad positive outcome in negotiations between China and the U.S. and renewed inflationary pressure led to a sharp decline in demand for corporate stocksAuthor: Pati Gani
10:10 2025-06-13 UTC+2
2083
- The crowd will be punished for its overconfidence in buying the S&P 500 dip
Author: Marek Petkovich
09:35 2025-06-13 UTC+2
2008
- EUR/USD: Trading Plan for the U.S. Session on June 13th (Review of Morning Trades)
Author: Miroslaw Bawulski
12:31 2025-06-13 UTC+2
1978


