

Corak sebenar

Bearish Symmetrical Triangle
was formed on 21.04 at 23:42:32 (UTC+0)
signal strength 3 of 5

According to the chart of M30, NZDJPY formed the Bearish Symmetrical Triangle pattern. Description: The lower border is 83.98/84.43 and upper border is 84.90/84.43. The pattern width is measured on the chart at -92 pips. The formation of the Bearish Symmetrical Triangle pattern evidently signals a continuation of the downward trend. In other words, if the scenario comes true and NZDJPY breaches the lower border, the price could continue its move toward 84.13.
Juga lihat
- All
- All
- Bearish Rectangle
- Bearish Symmetrical Triangle
- Bearish Symmetrical Triangle
- Bullish Rectangle
- Double Top
- Double Top
- Triple Bottom
- Triple Bottom
- Triple Top
- Triple Top
- All
- All
- Buy
- Sale
- All
- 1
- 2
- 3
- 4
- 5
बियरिश आयत
was formed on 02.06 at 06:43:05 (UTC+0)
signal strength 1 of 5
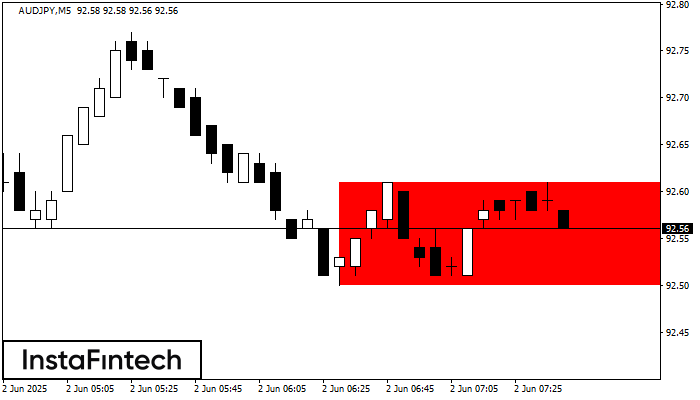
M5 के चार्ट के अनुसार, AUDJPY से बियरिश आयत बना। इस प्रकार का पैटर्न एक प्रवृत्ति निरंतरता को इंगित करता है। इसमें दो स्तर होते हैं: प्रतिरोध 92.61 - 0.00
M5 और M15 समय सीमा में अधिक फाल्स एंट्री पॉइंट्स हो सकते हैं।
Open chart in a new window
डबल बॉटम
was formed on 02.06 at 06:15:53 (UTC+0)
signal strength 2 of 5
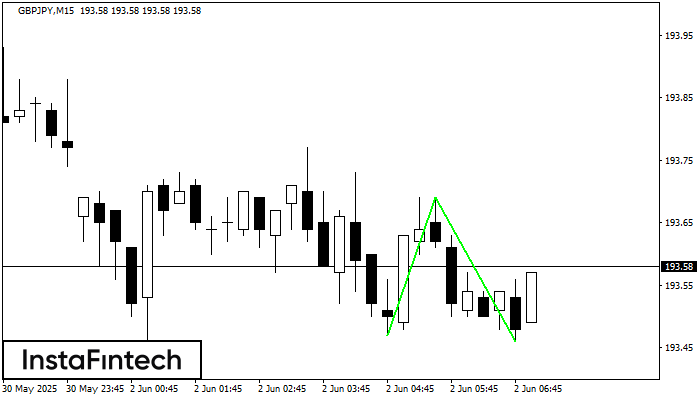
डबल बॉटम पैटर्न GBPJPY M15 पर बना है। विशेषताएं: समर्थन स्तर 193.47; प्रतिरोध स्तर 193.69; पैटर्न की चौड़ाई 22 पॉइंट्स। यदि प्रतिरोध स्तर टूट जाता है, तो रुझान में बदलाव
M5 और M15 समय सीमा में अधिक फाल्स एंट्री पॉइंट्स हो सकते हैं।
Open chart in a new window
बुलिश आयत
was formed on 02.06 at 06:00:14 (UTC+0)
signal strength 2 of 5
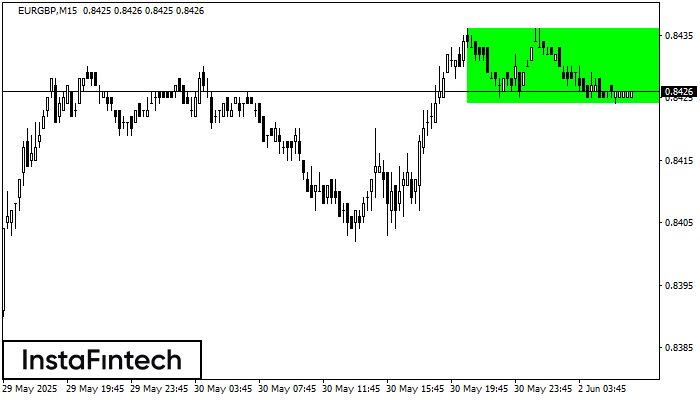
M15 के चार्ट के अनुसार, EURGBP से बुलिश आयत बना। इस प्रकार का पैटर्न प्रवृत्ति की निरंतरता कि ओर इंगित करता है। इसमें दो स्तर होते हैं: प्रतिरोध 0.8436
M5 और M15 समय सीमा में अधिक फाल्स एंट्री पॉइंट्स हो सकते हैं।
Open chart in a new window

